52
INTRODUCTION
The data we collected on the EIS market
can be broken down and analysed in a
number of different ways, using a number
of different criteria. The following sections
of this report provide an overall analysis of
the EIS market, looking at how it has grown
in recent years, the different economic
sectors where investments can be made
and the different structures available for
investors looking to access the market.
We break the data down by:
Sector
Structure
Focus (investment objective)
Size of fundraise
Forecast returns
Charges
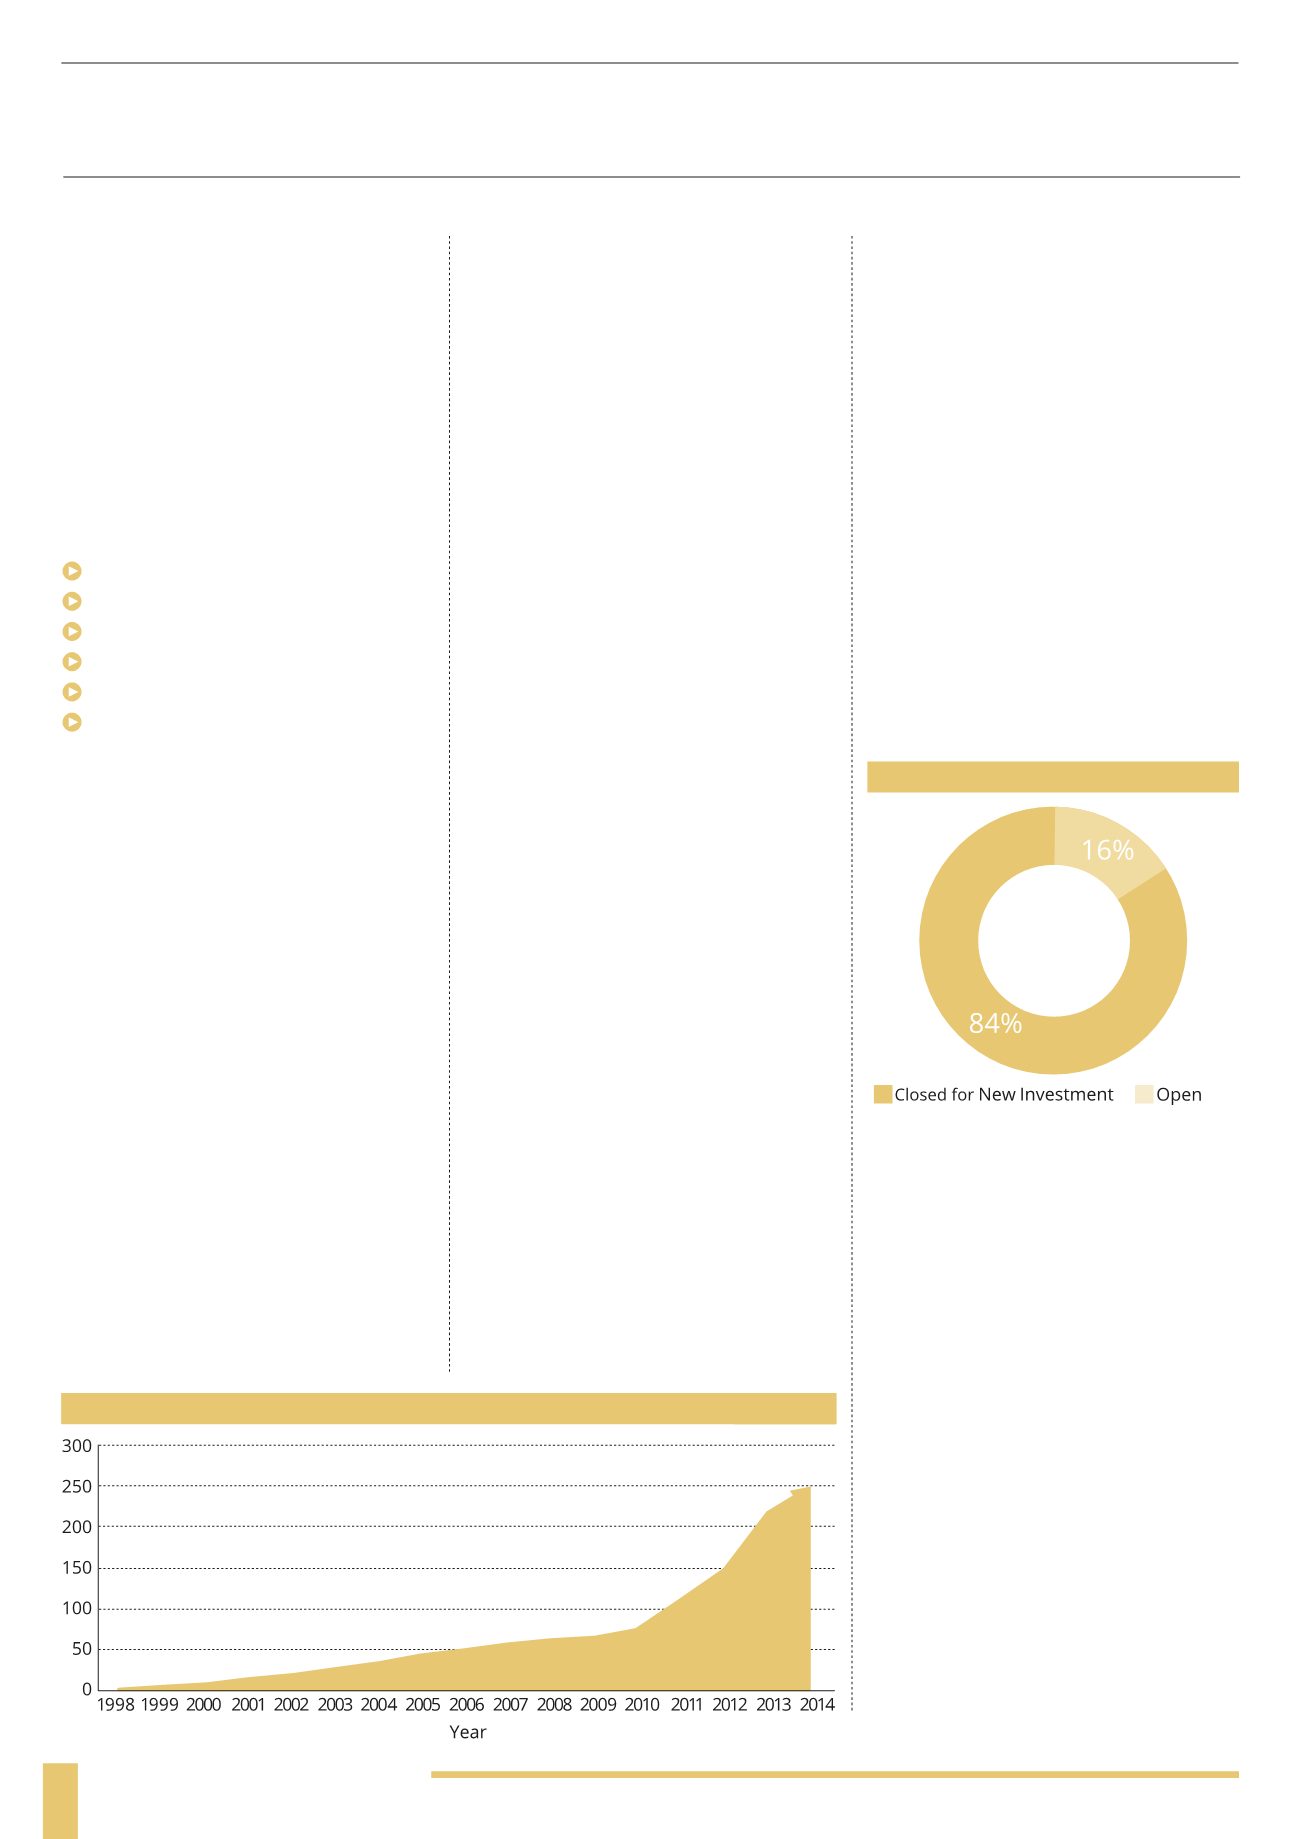
MARKET GROWTH
The first investment included as part of
this analysis was launched in 1998. The
market saw relatively modest and stable
growth between 1998 and 2004 with only
a small number of new product launches
across both single company investments
and managed funds. In 2005 there was
a notable increase in the number of new
product launches, which can probably
be attributed to the total investment
amount qualifying for tax relief increasing
from £150,000 to £200,000. The period
2010 – 2014 has witnessed the most
rapid expansion in the market though:
there has been a 229% increase in the
number of investments in this time.
This recent rapid growth can be
attributed to a number of factors.
Firstly, awareness of the benefits of EIS
has been increasing over time, in part
due to the marketing efforts of some
of the bigger providers and the adviser
education provided by the EISA.
Secondly, after seeing conventional
assets become quite highly correlated
during the 2008 crash and subsequent
recession, there has been a recognition that
conventional portfolios require additional
sources of diversification – something that
EIS products can provide as investments
into parts of the economy that are not
generally covered by mainstream funds.
Third, there has been an appetite for
higher returns. Low interest rates and
low bond yields have depressed the
returns on fixed income investments,
and many commentators are forecasting
that equities will continue to be volatile in
the future, with more 2008-style shocks
in store. At the same time, investors are
realising that they need to save more
for their retirement as life expectancy
increases. These factors have pushed
investors and advisers into searching for
assets with higher than average returns,
and many EIS investments fit the bill.
Fourth, as mentioned in previous sections of
the report, changes in both the annual and
lifetime allowances in pension contributions
and the increased scope of EIS to cover
more, and bigger, companies will also have
played a part in this increase in activity.
Finally, the flip-side of the 2008
narrative is that we are now seeing the
UK economy starting to recover and
improve and many advisers and their
clients feel that investing into smaller
companies is a good way to participate
in and benefit from that recovery.
It is important to note the limitations in
the data collection process as detailed
at the end of this section – there is
an in-built bias towards investments
launched more recently, which makes
the recent growth appear more
dramatic than it has been in reality.
CURRENT OPPORTUNITIES
This analysis covers 244 EIS investment
opportunities across single company
investments and discretionary funds/
portfolios. Of these, 16% of the products
are open to new investment, with 44% of
these being evergreen products (always
open to new investment). It’s worth
noting that a large number of investment
opportunities closed at the end of the
2013/14 tax year at the start of April.
The vast number of opportunities focus
on a single (or sometimes 2) tax year
period, so that investors can claim (and
offset) tax for a specific period. Investment
launches often occur in the final quarter
of the year with a large amount of activity
ramping up towards the end of the tax
year as investors (and their advisers)
look to put their tax affairs in order.
“The enterprise investment
scheme has been a very successful
programme and has no doubt
addressed a significant funding
gap in the UK market”
Bruce Macfarlane, MMC Ventures
OVERALL ANALYSIS
EIS MARKET GROWTH
(1998-2014)
OPEN vs CLOSED
(1998-2014)


