60
The Tax Efficient Review published some
timely data on EIS funds raised in the
2013/14 tax year (see table opposite). In
the main this is based upon data provided
by the relevant providers. The investment
opportunities have been categorised
using their own unique methodology.
What the data shows us chimes with the
findings from our research. The two biggest
areas of investment are funds or portfolios
with a track a record – supporting our
point that as a track record is established,
launching and raising investment into a
fund becomes easier. The biggest sector
for investment is renewable energy, with
62% of investment during the period. The
second biggest sector contained a mixture
of growth focused funds, which shows that
the tax incentive is working, pushing capital
into smaller, growth focused companies.
This also demonstrates that companies
without a track record can struggle
to establish themselves. Perhaps
surprisingly, there were not many AIM
focused EIS investments, even though
investing in AIM listed companies
provides some additional insight into the
underlying investments that is not always
available with non-listed companies.
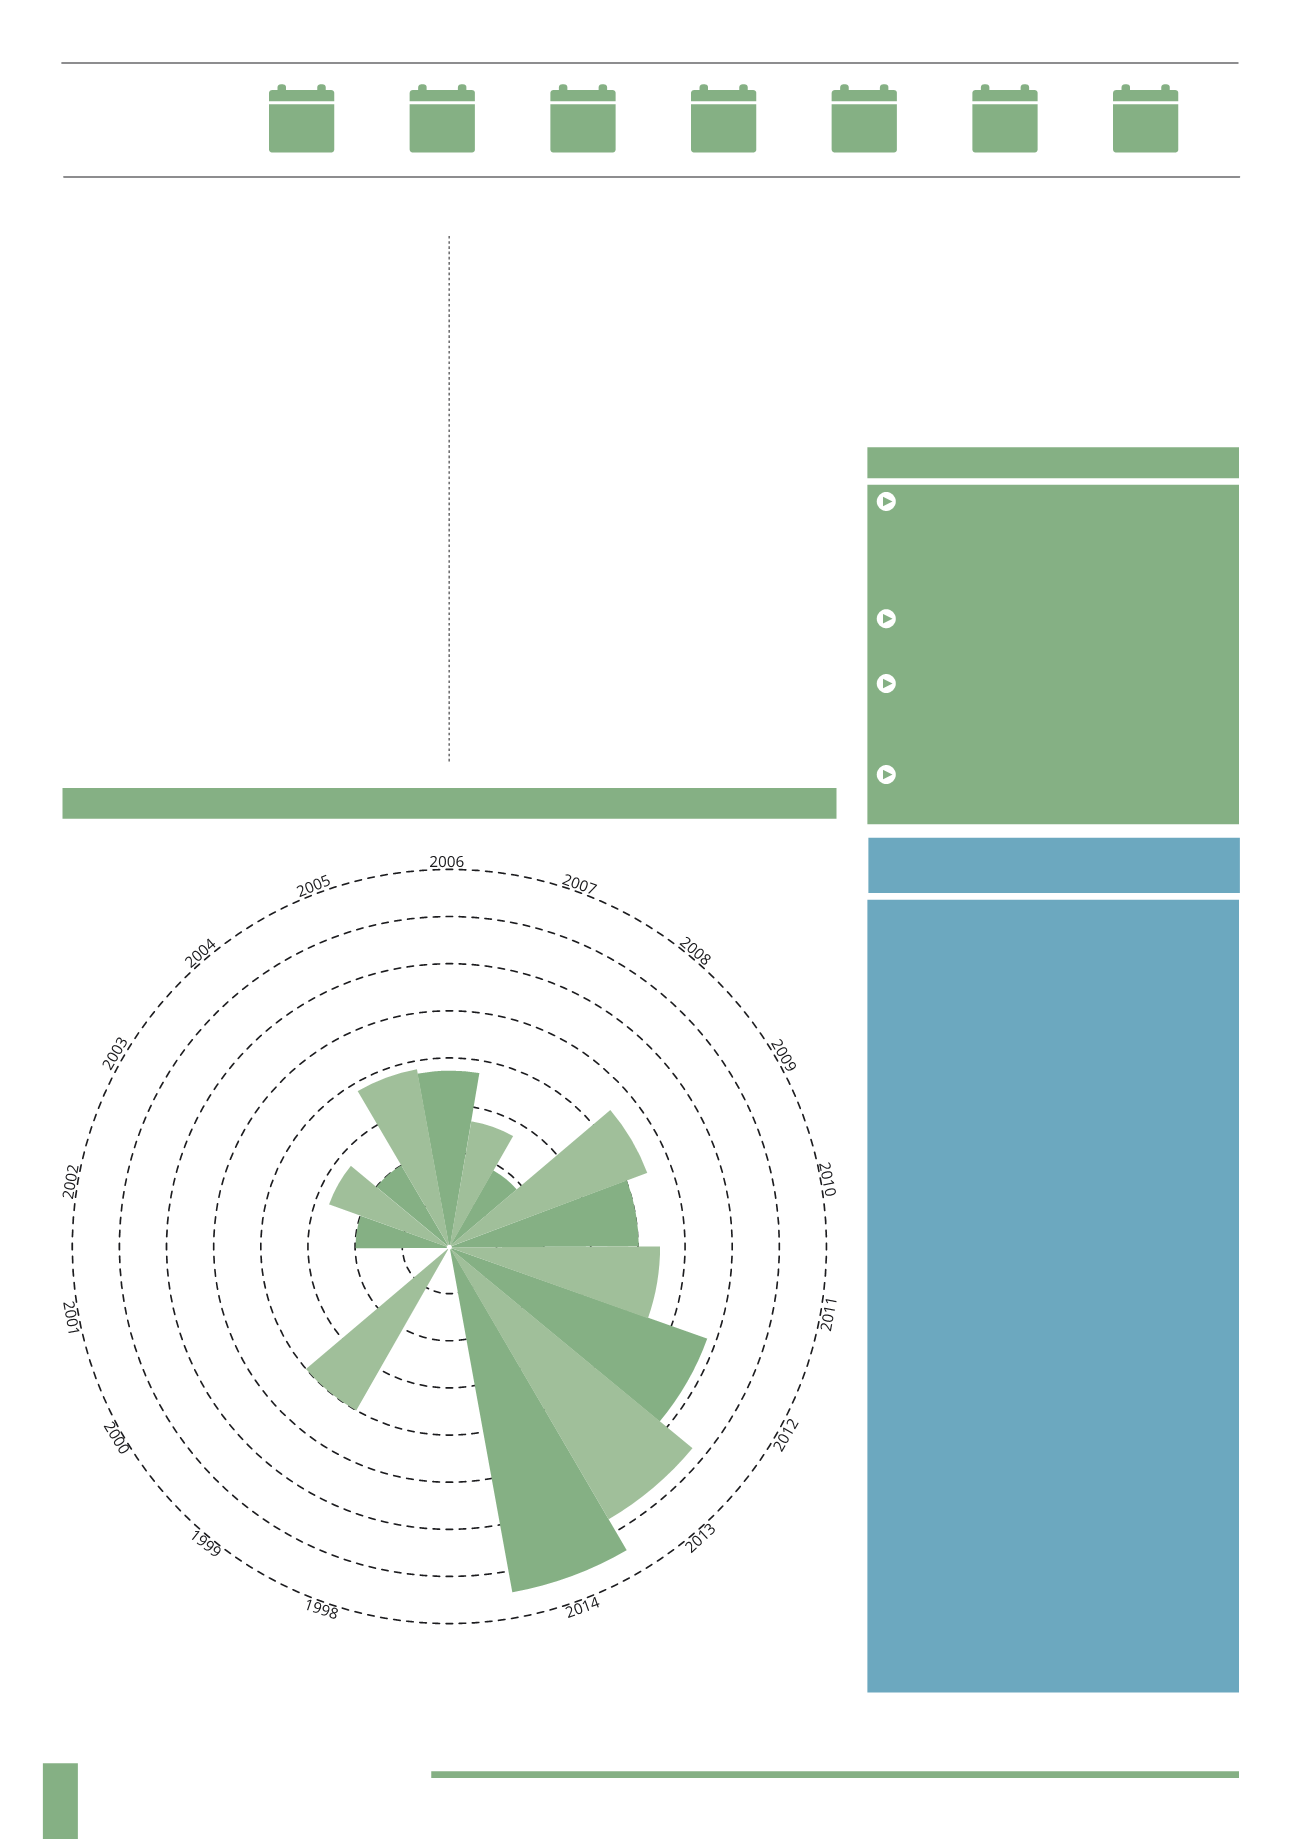
AVERAGE ANNUAL TARGETS PER OPPORTUNITY
(1998 - 2014)
£10m
£6.5m
£6.43m
£11.35m
£11.25m
£9.79m
£16.57m
£14.48m
£5m
£10m
£9.29m
£17.77m
2014
2013
2012
2011
2010
2009
2008
FUNDRAISING
TARGET
GROWTH:
-31%
60%
-11%
14%
28%
14%
7%
AVERAGE ANNUAL
FUNDRAISING TARGETS
It is more meaningful to focus specifically
on fund/portfolio investment opportunities
here as they account for the largest share
of the EIS market and have seen the largest
amount of growth in recent years. The main
aim of looking at the growth in this way is
to see whether, on average, investment
providers have increased their fundraising
each year as investor interest and the
number of available opportunities in the
market has increased. This will also show
whether providers have more confidence
in their ability to raise money and have
increased their targets each year.
Between 1998 and 2005 there was a lot of
variation in the average fundraising target.
There were a number of years when there
weren’t any fund launches recorded or
where there were only a very small number.
There was also a noticeable drop in
fundraising in 2007 and 2008, which is
likely to be down to the performance of
the wider financial markets. However there
was then a jump in the average fundraising
target in 2009, and since then we can
identify a pattern of steady increases in the
average target over the last four years.
It is also interesting to note how the smallest
and largest fundraises have changed over
this period. The lowest fundraising amount
has generally fallen over the last five years,
and at the same time the highest has
increased. This could be down to the wide
range of opportunities now available in the
sector, but perhaps can also be attributed
to there being a number of new entrants
in recent years with smaller funds.
At the other end of the scale, the increase
in the number of large funds could be
down to growing investor confidence in and
awareness of the sector, and also wider
economic confidence stimulating larger
scale investment projects. The growth in
the energy sector generally is also
an important factor here.
KEY POINTS
Single company investments are
smaller scale (raising £3.79m on average)
compared to managed funds/portfolios
(raising £12.84m on average)
Technology based investments have
on average the largest fundraising targets
Exit focused investment strategies
have on average the largest fundraising
targets
39% of investments did not meet their
upper level fundraising target
ANOTHER LOOK AT
FUNDRAISING TARGETS


