62
The following section looks at the returns
available in the EIS market. There is
often a criticism that EIS investments
focus too much on the tax benefits
rather than the actual investment case
for underlying opportunities. This can
often skew the returns and make the
investment manager’s performance
appear disproportionally positive.
This also presents a challenge when
it comes to assessing the market, as
some opportunities are advertised with
targeted returns before tax relief, whilst
others advertise returns after tax relief.
EIS investments must be held for a
minimum of three years in order to qualify
for tax relief. The vast majority of EIS
investments look to pay returns at the end
of the investment term (often variable)
in the form of a capital gain which is tax
free. Any dividends paid are subject to
Income Tax at the investor’s marginal rate.
Investors therefore have to wait a number
of years for returns to be realised. Single
company investments can provide the
investor with more flexibility as they can
sell their shares as and when they wish
(but they must of course find a buyer).
A very small number of investment
opportunities look to pay annual
returns in the form of a dividend or
royalties based on the performance
of the underlying company, but of
course this income is taxable.
OVERALL RETURNS
Every investment in the EIS market
offers variable returns – there are no
products offering a fixed rate of return.
Returns are usually positioned as a
target level of return. It’s worth noting
that it has not been possible to collect
return information on every investment
included in this analysis, with 35% of
opportunities not quoting their targeted
returns in their marketing literature
or providing them to us on enquiry.
Investments only quoting total returns
range from 100% to as high as 500%.
This is often worded in the parlance of
angel investors as ‘5x return of capital’.
These returns can look very attractive,
but they must be looked at based upon
time – a 500% return may not appear as
attractive if it’s going to take 10-20 years
to be realised. As always, the exit is as
important as the level of return achieved.
Whilst overall there is a very wide range of
returns available in the market, it is more
meaningful to look at the products when
split down by structure. Single company
EIS investments have the highest range
of targeted returns and make up both
extremes of the market. A number of
the returns on offer are very aggressive,
and are therefore likely to present some
very high risks to investors. The average
targeted return from single company
EIS investments is 23% per year.
EIS funds/portfolios have more moderate
targeted returns but these still range
from a conservative 6% per year to a
very aggressive 60%. The average for
this structure is lower than the market
average at 18%. There are only a very small
number of EIS funds/portfolios that offer
particularly high returns and these are
all found within the Technology sector.
While there are some extremely high
returns targeted in the market, it is
important to note that returns are often
advertised including tax relief (often for a
higher rate tax payer) and this therefore
skews the actual return achieved by the
manager. Ordinary rate tax payers would
not benefit from the same sort of returns
and investors must be mindful that the
tax reliefs on offer could potentially hide
poor performance from the company and/
or fund manager when the investment is
compared to more mainstream investment
opportunities (although of course, provided
the investor gets the tax reliefs this
is somewhat of a moot point).
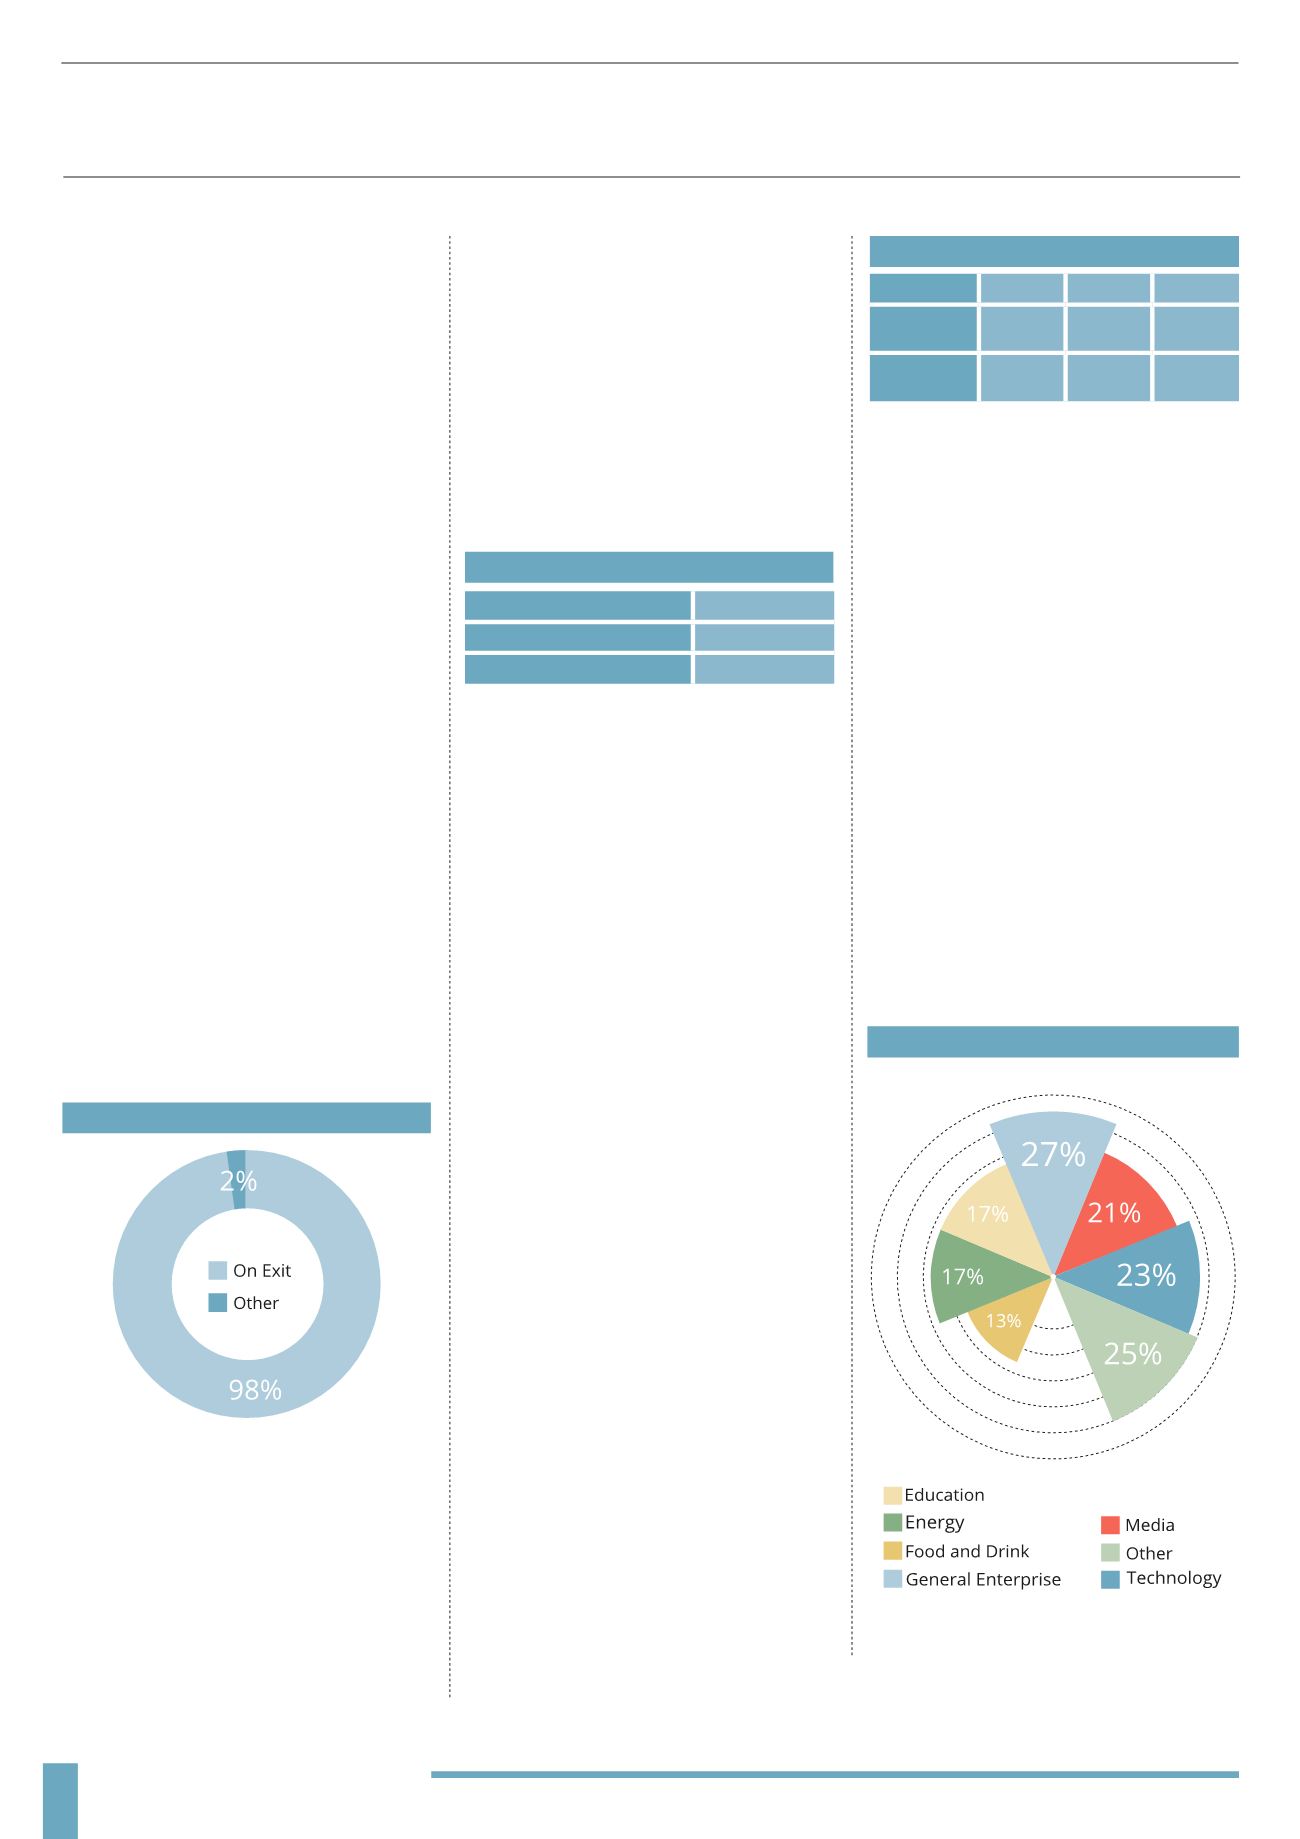
RETURNS BY SECTOR
The highest average forecast return
comes from the General Enterprise
sector at 27%. At the other end of
the scale Education offers the lowest
targeted return at only 13% per year.
Media, Technology and Other all target
average returns of over 20% per year, which
would signal that these sectors present a
number of high risk/reward opportunities.
The Energy sector offers lower returns of
17% on average, which is still very strong
compared to mainstream opportunities.
As many of these investments are lower
risk, asset backed investments that benefit
from long-term revenue streams based on
government subsidies, it is easy to see why
they have been so attractive to investors.
But even within each sector there is a very
wide range of potential returns, offering
a large number of opportunities for
investors targeting varying risk profiles.
ANALYSIS BY RETURNS
FREQUENCY OF RETURNS**
RETURNS BY SECTOR*
Low
3%
High
84%
Average
20%
Low High Average
Single
Company
3% 84% 23%
EIS Fund/
Portfolio
6% 60% 18%
ANNUAL RETURNS*
RETURNS BY STRUCTURE**
*targeted **1998-2014
(1998-2014)
(1998-2014)


