58
STRUCTURE SPLIT BY FOCUS
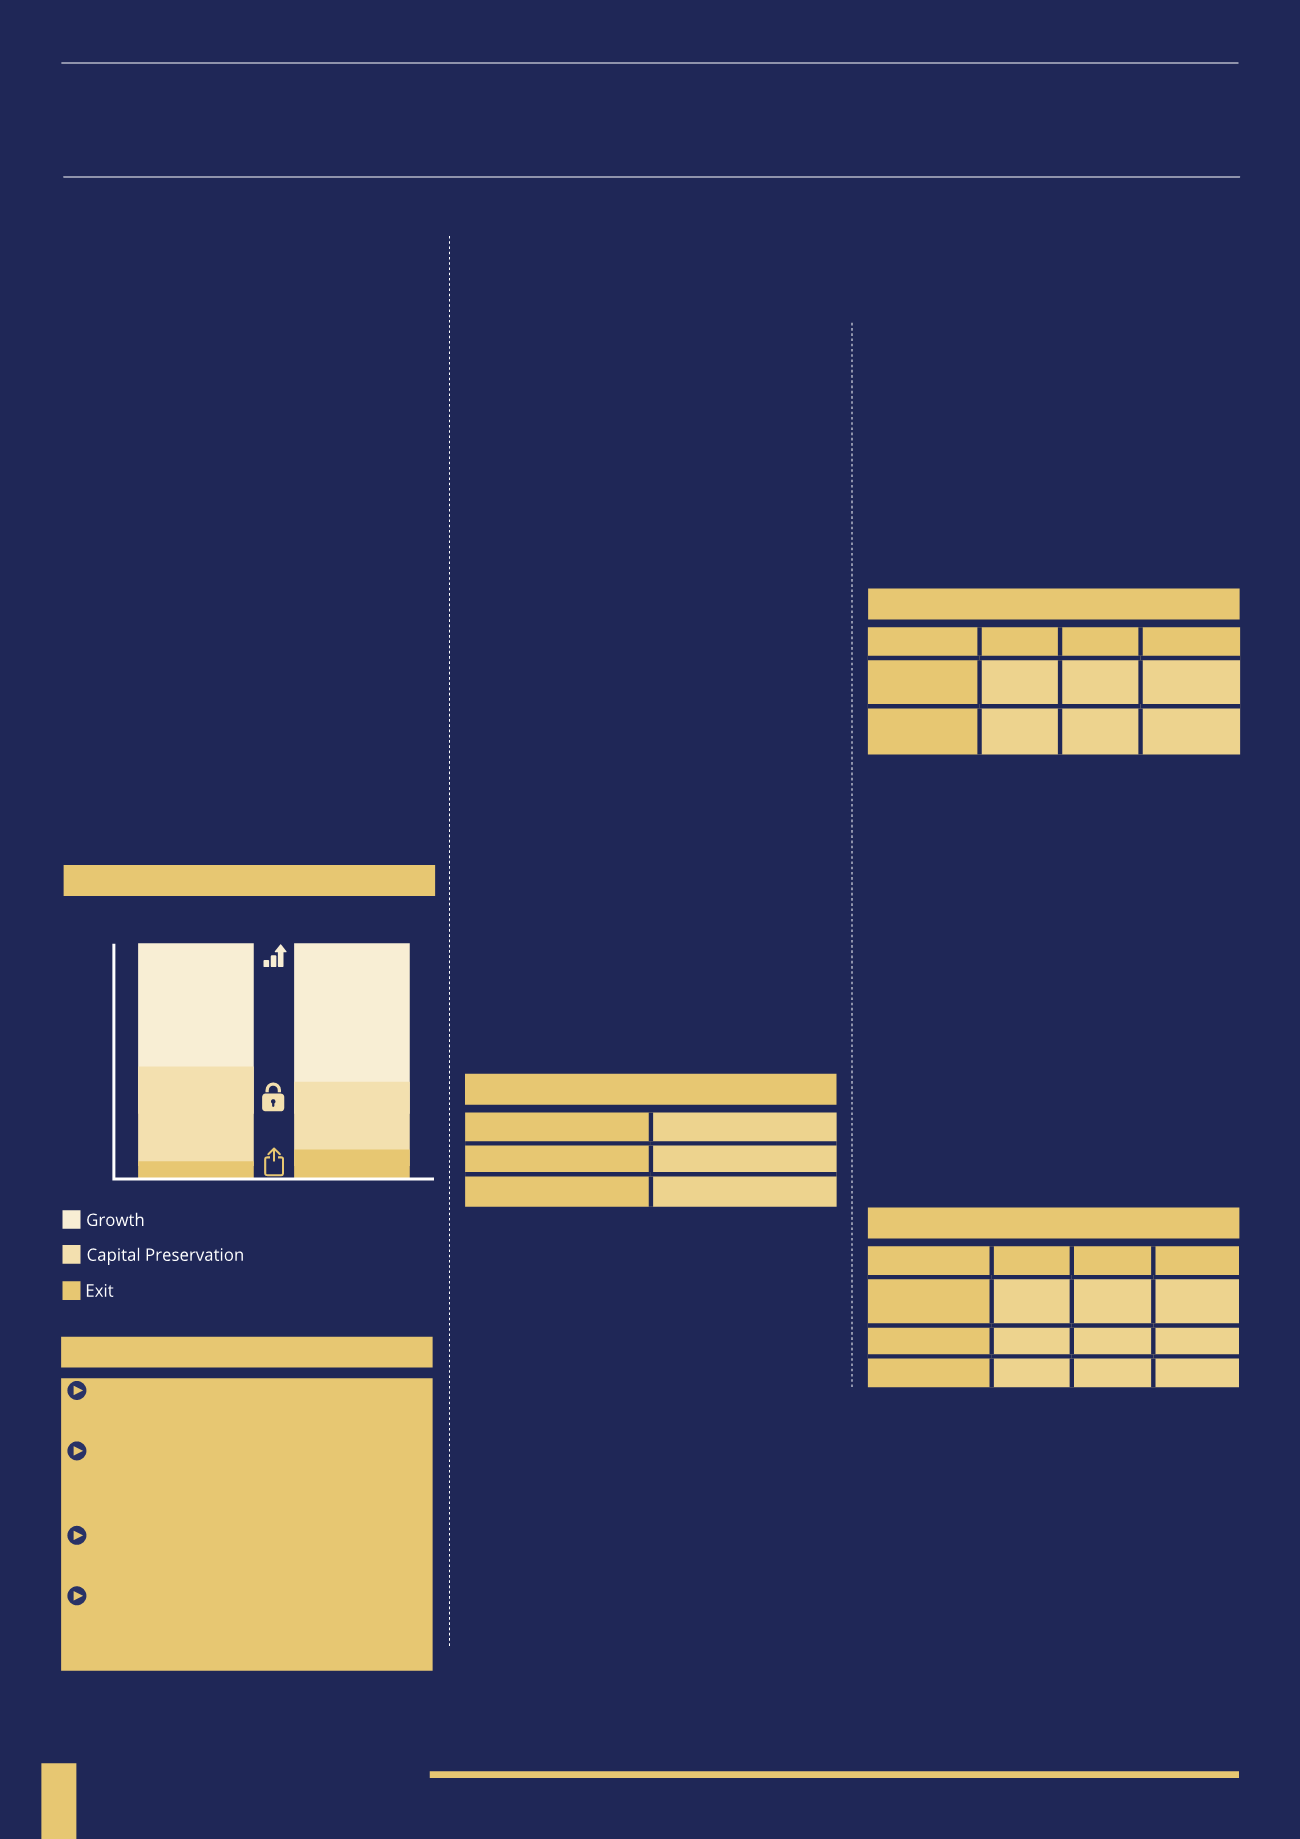
Another way to look at the investment
focus is to split it by investment structure.
The following charts look at how single
company investments and funds are
split down by investment focus.
51% of single company investments are
growth focused, 40% capital preservation
and only 9% exit. The higher proportion
of investments focused on capital
preservation could be due to the high
number of investments in the food and
drink sector. These often include take-
overs of established pubs and restaurants
and therefore they are asset backed
opportunities with lower levels of risk.
Funds have a higher focus on growth (59%
of investments) and a lower proportion
of investments focusing on capital
preservation. The higher number of growth
based investments could be attributed to
several funds focused on the Technology
sector, which as noted above tends to
be higher risk/higher return activity.
The fundraising target is the amount of
capital each investment offering (single
EIS company or managed fund/portfolio)
is looking to raise. It should represent
the provider’s confidence that they can
successfully deploy that amount of capital
productively and earn returns. Unfortunately
in the mainstream fund universe it can
also occasionally represent the provider’s
confidence that their marketing machine can
raise large sums of money that they can take
a healthy initial fee and on-going charges
from. This is a malaise that thankfully
does not seem to have spread to the EIS
market to date from what we can tell.
For single company investments, the size of
the fundraise is obviously dictated by the
activities they are undertaking and their
intentions for putting the capital to work. For
funds, the number of opportunities available
that meet their investment criteria is key.
Being under-capitalised is of course a major
problem as firms cannot develop according
to their business plans. However, being over-
capitalised is also an issue as it can make
it hard to generate returns for investors.
The average fundraising target across the EIS
market is just under £9.5m, but this ranges
from as low as £175,000 to as high as £75m.
FUNDRAISING TARGET
BY STRUCTURE
As discussed earlier, single company
investments are typically much smaller
fundraises. The average for companies
is £3.79m whilst for funds this is much
higher at £12.84m. Funds generally have
much higher fundraises due to the fact that
they are raising money to invest across
a number of underlying companies.
FUNDRAISING TARGET BY
INVESTMENT FOCUS
Exit focused investments had the highest
average fund size of £16m. We can speculate
that this is down to investor demand, or it
could be due to many of these investments
being either asset-backed, investments
into more established companies or
investments into renewable energy
installations – all of which are expensive.
Growth focused investments had the
lowest average fundraising target of
£7.55m. Growth focused opportunities are
usually investments into smaller start-up
companies that are cheaper to acquire.
KEY POINTS
Growth focused investments account
for 56% of the EIS market
The Technology sector, which favours
small start-up companies, has 100%
growth focused investments
The Media sector is the most balanced
based on investment focus
Fund/portfolio structures have a higher
focus on growth than single company
investments
FUNDRAISING ANALYSIS
SPLIT BY FOCUS
FUNDRAISING TARGETS
Low
£175,000
High
£75,000,000
Average
£9,418,000
TARGET BY STRUCTURE
Low High Average
Single
Companies
£175k £15m £3.79m
EIS Fund/
Portfolio
£1.2m £75m £12.84m
“Funds and portfolios generally have a higher investment focus on growth and a
lower proportion of investments focused on capital preservation”
Low High Average
Capital
Preservation £250k £40m £9.94m
Exit
£250k £75m £16.08m
Growth
£175k £50m £7.55m
TARGET BY FOCUS
0%
10%
20%
30%
40%
50%
60%
70%
80%
90%
100%
Single Company
Fund/Portfolio
(1998-2014)
51%
59%
40%
29%
9%
12%


