56
As noted throughout the preceding
analysis, the EIS market includes a mix
of single company investments and
managed funds/portfolios. The following
section looks at the split of the market
between these two structures and how
they have each developed over time.
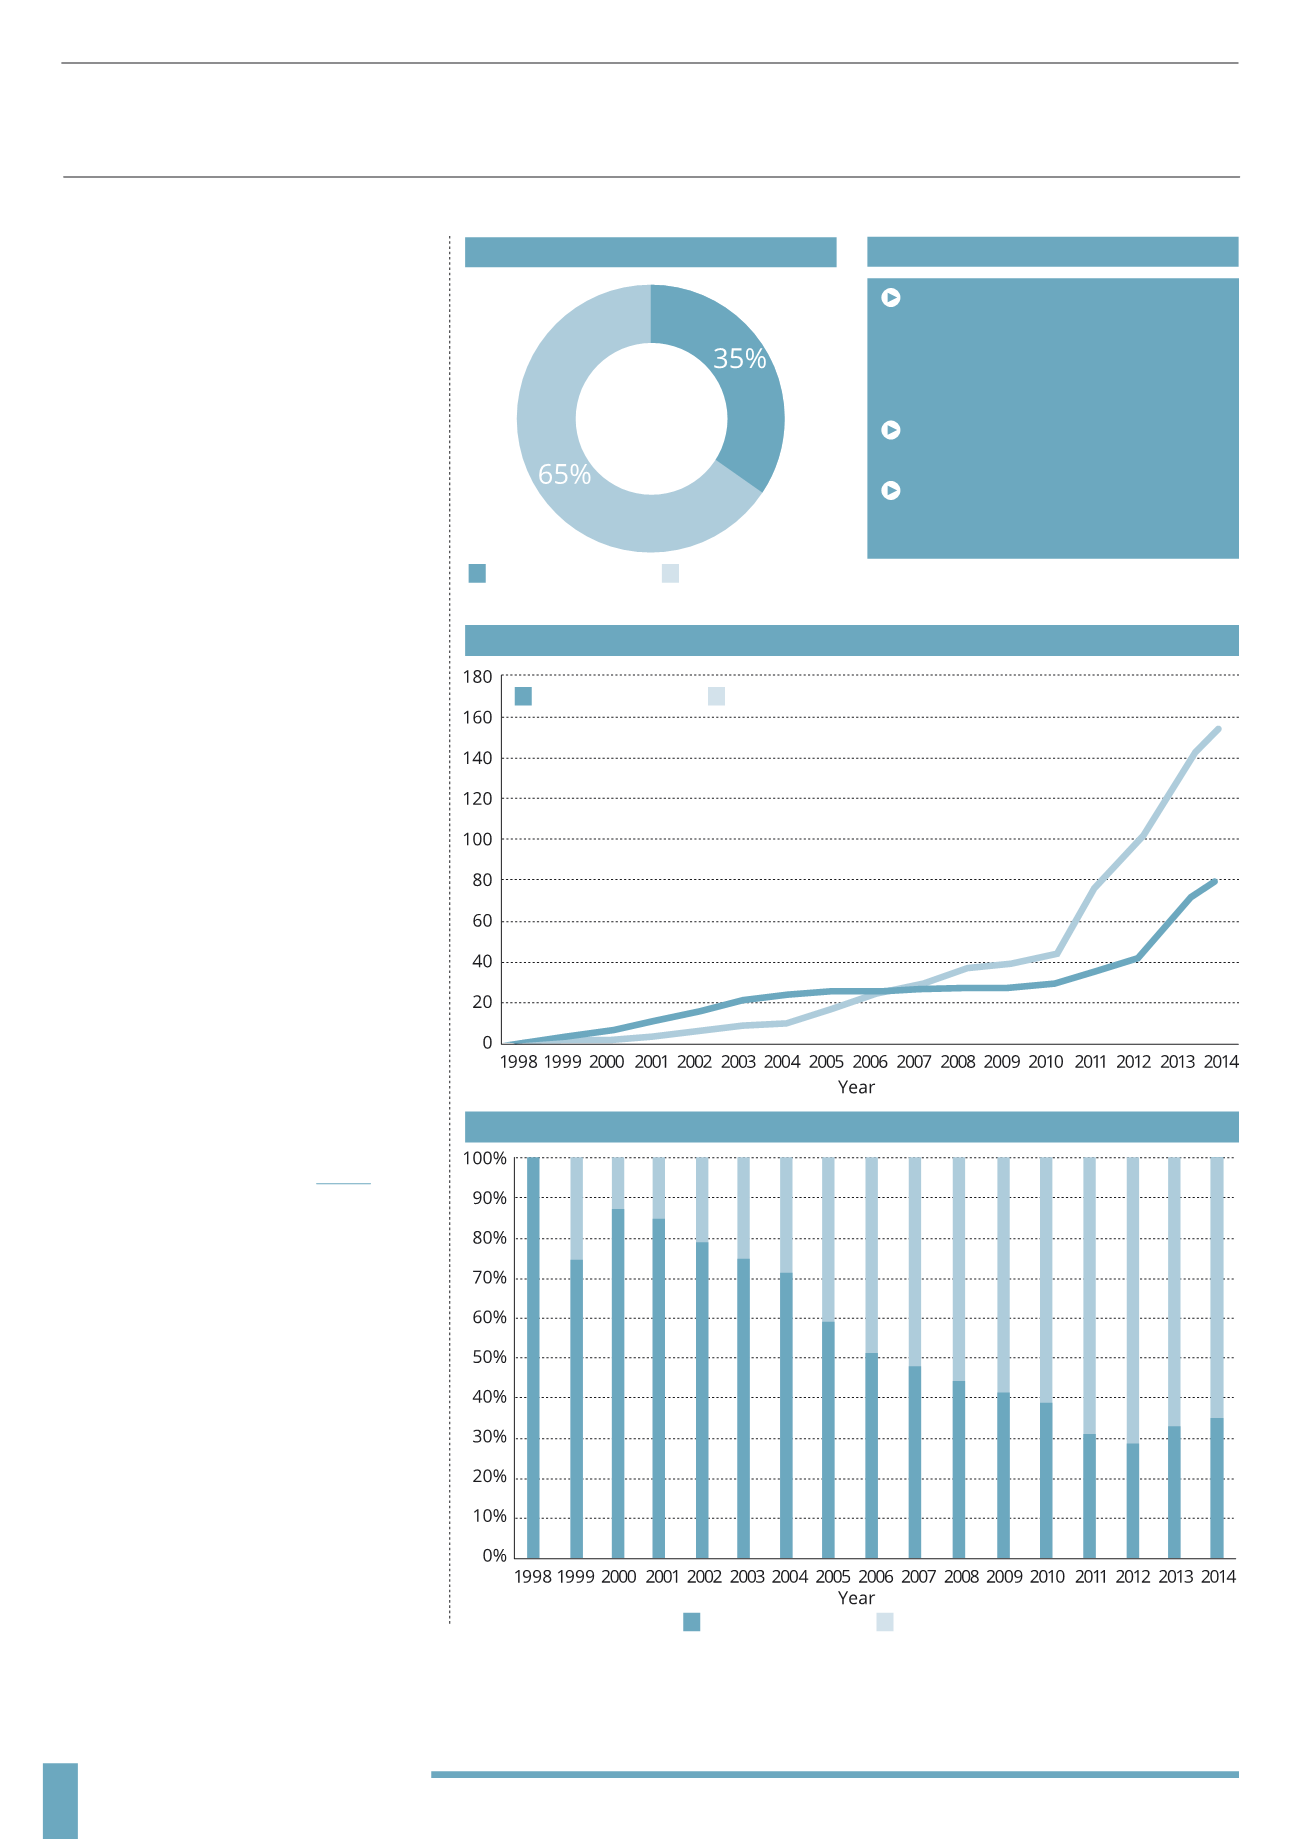
Based on the investments identified, the EIS
market is currently made up of 65% funds
and 35% single company investments. 17%
of EIS funds and 14% of single companies
are currently open for investment.
MARKET GROWTH
BY STRUCTURE
Splitting the data between these two
types of investment structure, we can
track the growth in the EIS market and the
changes in the landscape over the period
since 1998. In the initial stages of the EIS
market, single company investments were
the most popular. Funds started from a
very low base and were only available in
very small numbers in the early days of
EIS. However, as the EIS concept became
more widely understood, funds did begin
to enter the market in increasing numbers.
The real catalyst for funds however, was
the rule changes to allow larger companies
to qualify for EIS status. At a stroke the
EIS investment universe was both bigger
and more investable, and fund structures
became more feasible – this is reflected in
the steep up-tick in fund launches in 2010.
Both structures saw their highest number
of product launches in 2013, which can be
attributed to the drivers behind the growth
in the market we’ve discussed
–
lower pension allowances, improved EIS
benefits, an increasing investor appetite for
risk/returns and the need for diversification.
We can also speculate that as fund
managers become more established and
can evidence a track record of success, it
becomes easier to launch new funds – also
contributing to the increasing number of
fund based opportunities in the market.
ANALYSIS BY STRUCTURE
SPLIT BY STRUCTURE
HISTORIC GROWTH BY INVESTMENT STRUCTURE
(1998 - 2014)
HISTORIC MARKET SHARE BY INVESTMENT STRUCTURE
(1998 - 2014)
KEY POINTS
From 1998 to 2005 single company
opportunities dominated the market, but
since 2007 fund/portfolio investments
have grown to account for the largest
share of opportunities
2013 saw the greatest number of
product launches in both structures
As managers establish strong track
records the fund market will continue to
grow
Single Company
Single Company
Fund/Portfolio
Fund/Portfolio
Single Company
Fund/Portfolio
(1998-2014)


