63
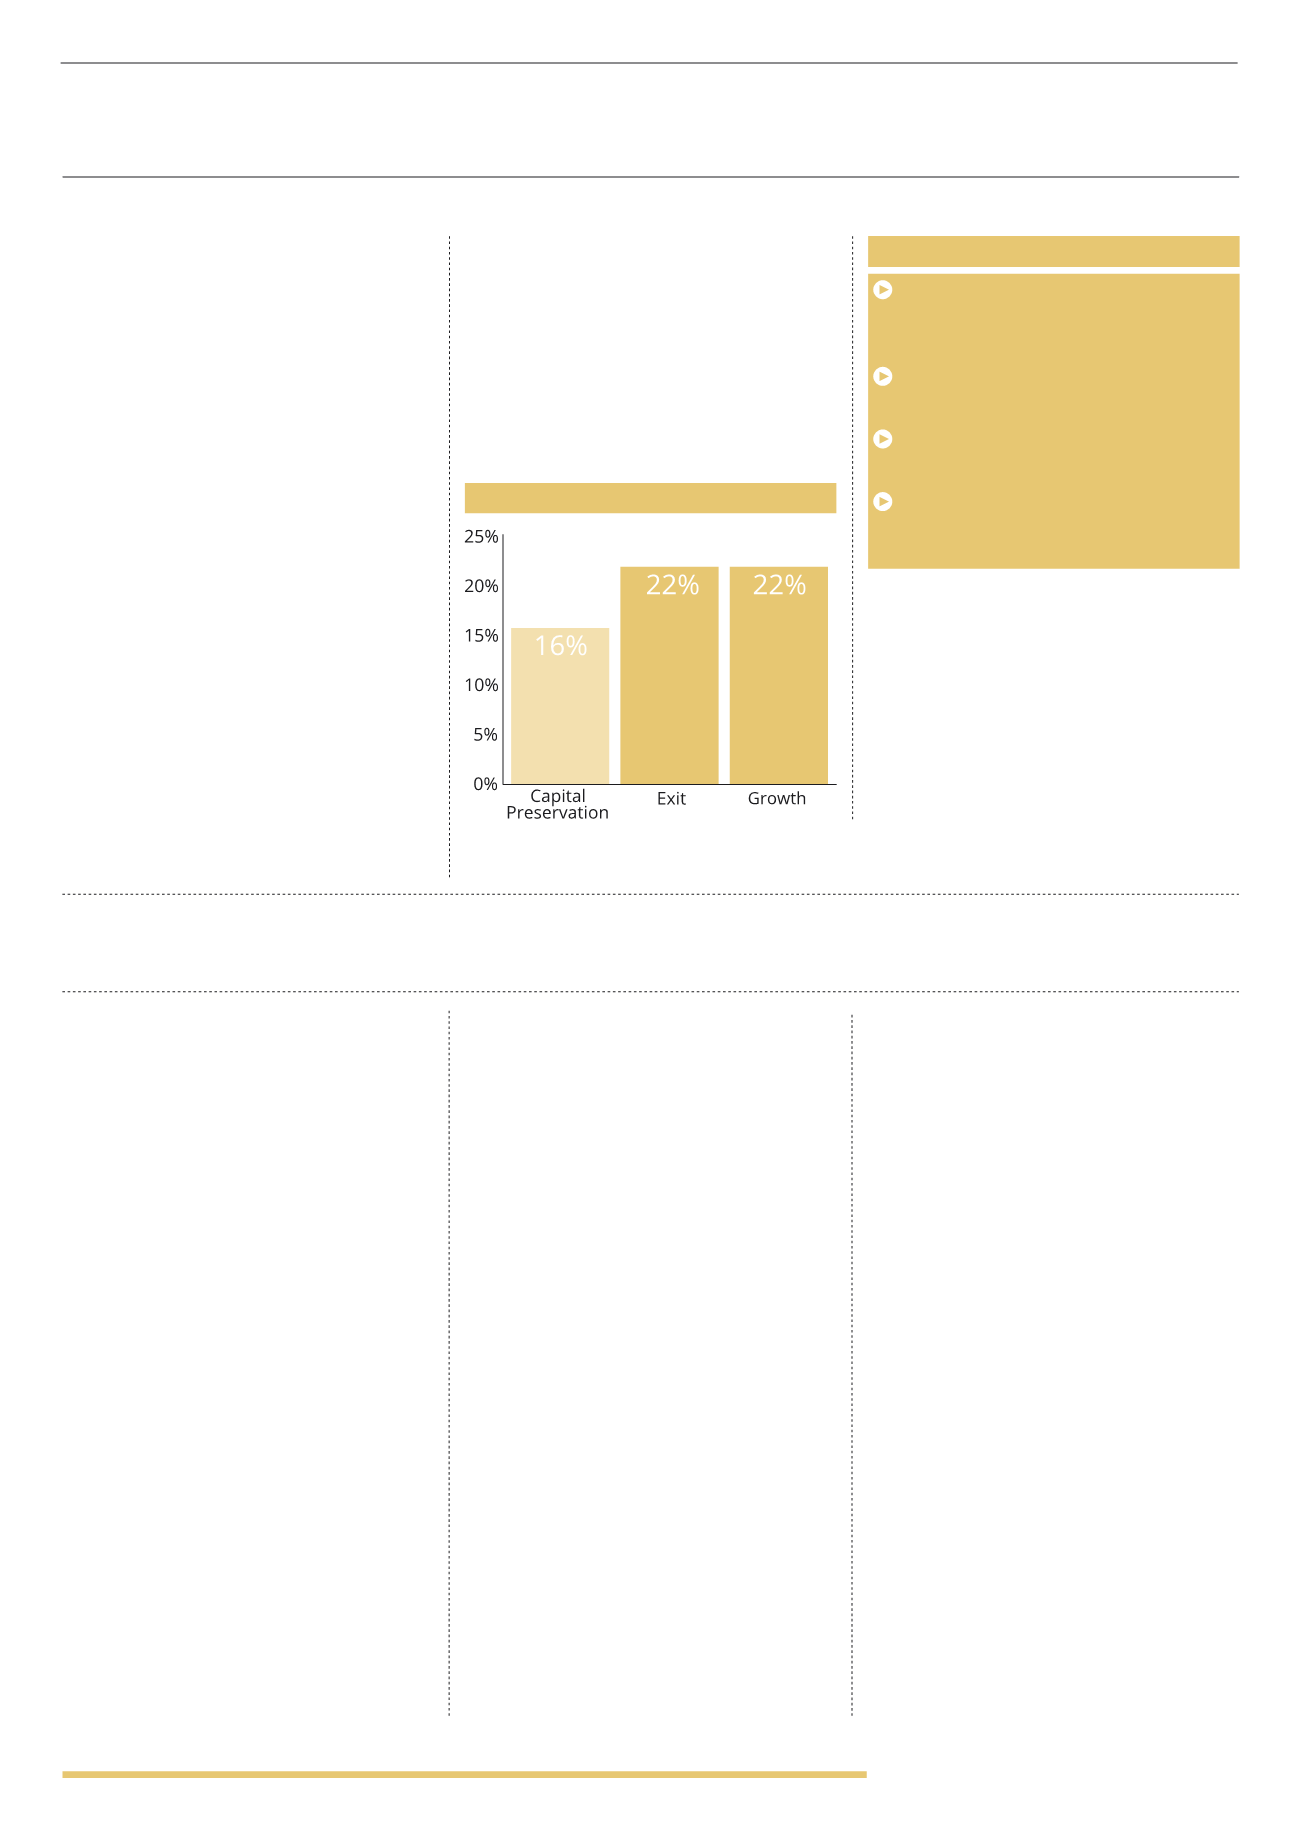
AVERAGE ANNUAL RETURNS
BY INVESTMENT FOCUS
Both growth and exit opportunities
have a targeted average return of 22%
per year, which is surprising as growth
opportunities are likely to take on
inherently more risk and often focus on
earlier stage start-up companies. This is
even more surprising when looking at the
range of targeted returns on offer, with
exit focused investments ranging from
12-84% per year and growth focused
from 6-76% per year. Note though that a
small number of exit focused investments
targeting very high (speculative) returns
has skewed the average to some extent
here. Growth focused investments
range from 6% to 76% per year.
A number of growth focused investments
target an overall total return, rather
than splitting this down into a targeted
average annual return. The average total
return is 271% which is particularly strong,
but of course the attractiveness of this
return will depend upon the timeframe
over which the investment is realised.
The following section looks at the
charges associated with EIS investment
opportunities. The focus here is on
funds and portfolio services which
use the experience and expertise
of a specialist investment manager.
There have only been five sectors
included in this analysis as a number
of sectors did not include a sufficient
number of fund based investments
to undertake meaningful analysis.
High charges are one of the main criticisms
associated with EIS investments. There are
three main charges that are levied on pretty
much every investment in the market: an
initial fee; an annual management charge
(AMC) and a performance fee. The initial
fee is taken upfront when an investor first
invests, and this therefore affects the
amount of capital that actually reaches the
underlying investments. Pre RDR, the initial
fee would also cover IFA commissions.
Looking at the market as a whole,
the initial fee ranges from 1% to as
high as 6.5%. The average is 4.3%.
This is extremely high, particularly when
compared to mainstream fund based
investment opportunities, and could have a
dramatic impact on returns.
Products focused on capital preservation,
which are often asset backed and seen
as lower risk investment opportunities,
still offer strong returns which range from
3-72% per year, with an average of 16%.
Again when considering these
investments the impact that tax
reliefs have when calculating targeted
returns must be taken into account.
However, EIS investments are more
specialised and sourcing deals, research
and due diligence, and ongoing
monitoring (often including taking
an active role on the board) all have
higher costs associated with them.
The annual management charge is
commonly taken as a percentage of the
value of the fund on an annual basis. This
covers the active management involved with
EIS funds and portfolios. Some managers
levy this upfront, usually for the first 3
years, and others will take this fee at the
end of the investment when underlying
investments are sold. Other managers may
keep an allocation of cash un-invested in
order to cover this charge annually – this
again will affect performance as it means
less capital is invested from the outset.
AMC’s range from 0.5% to 3% per year.
0.5% is very competitive and lower than a
number of mainstream investment funds.
The average across the market is 1.82%,
which again is quite low, but investors
must also remember the initial fee and
take into account that there is a limited
amount of active buying and selling
throughout the term of the investment,
as most of the investment decisions
will have been made at the outset.
Both the initial fee and the AMC are due
regardless of the performance of the
underlying investment, with managers being
paid even when investments perform badly.
The performance fee is charged on exit,
as and when underlying companies are
sold and profits are realised. The fee is
usually set based on a hurdle rate, such
as 20% of any profit above 105p for every
100p invested. These fees range widely by
investment manager and include a range
of combinations of different hurdle returns
and different fees. The performance fee
incentivises managers’ to return a profit
as they share in the success, but it could
mean that they take on more risks in
search of this profit or that they are unfairly
rewarded with a high share of profits
when they haven’t truly earned them.
The lowest performance fee across the
market is 10% of profits above 105p, the
highest 25% of all profits and the mean
20% of all profits. These fees appear very
high, although if an investor is receiving
a strong return they may be happy for
t
he manager to take a share of success.
RETURNS BY FOCUS
ANALYSIS BY CHARGES
“Attractiveness of returns will depend upon the timeframe over which the investment is realised”
KEY POINTS
Returns quoted in investment material
often include tax benefits which
dramatically increases predictions
98% of investments pay returns on exit
and 100% are variable
Each sector has a wide range of returns
presenting a number of risk/return options
Exit and growth focus investment
strategies have the highest average
returns of 22%
(1998-2014)


