5
to understand
for and if the funds are
all about
le for
ment
ll as the
16%
58%
42%
37%
47%
MARKET RESEARCH
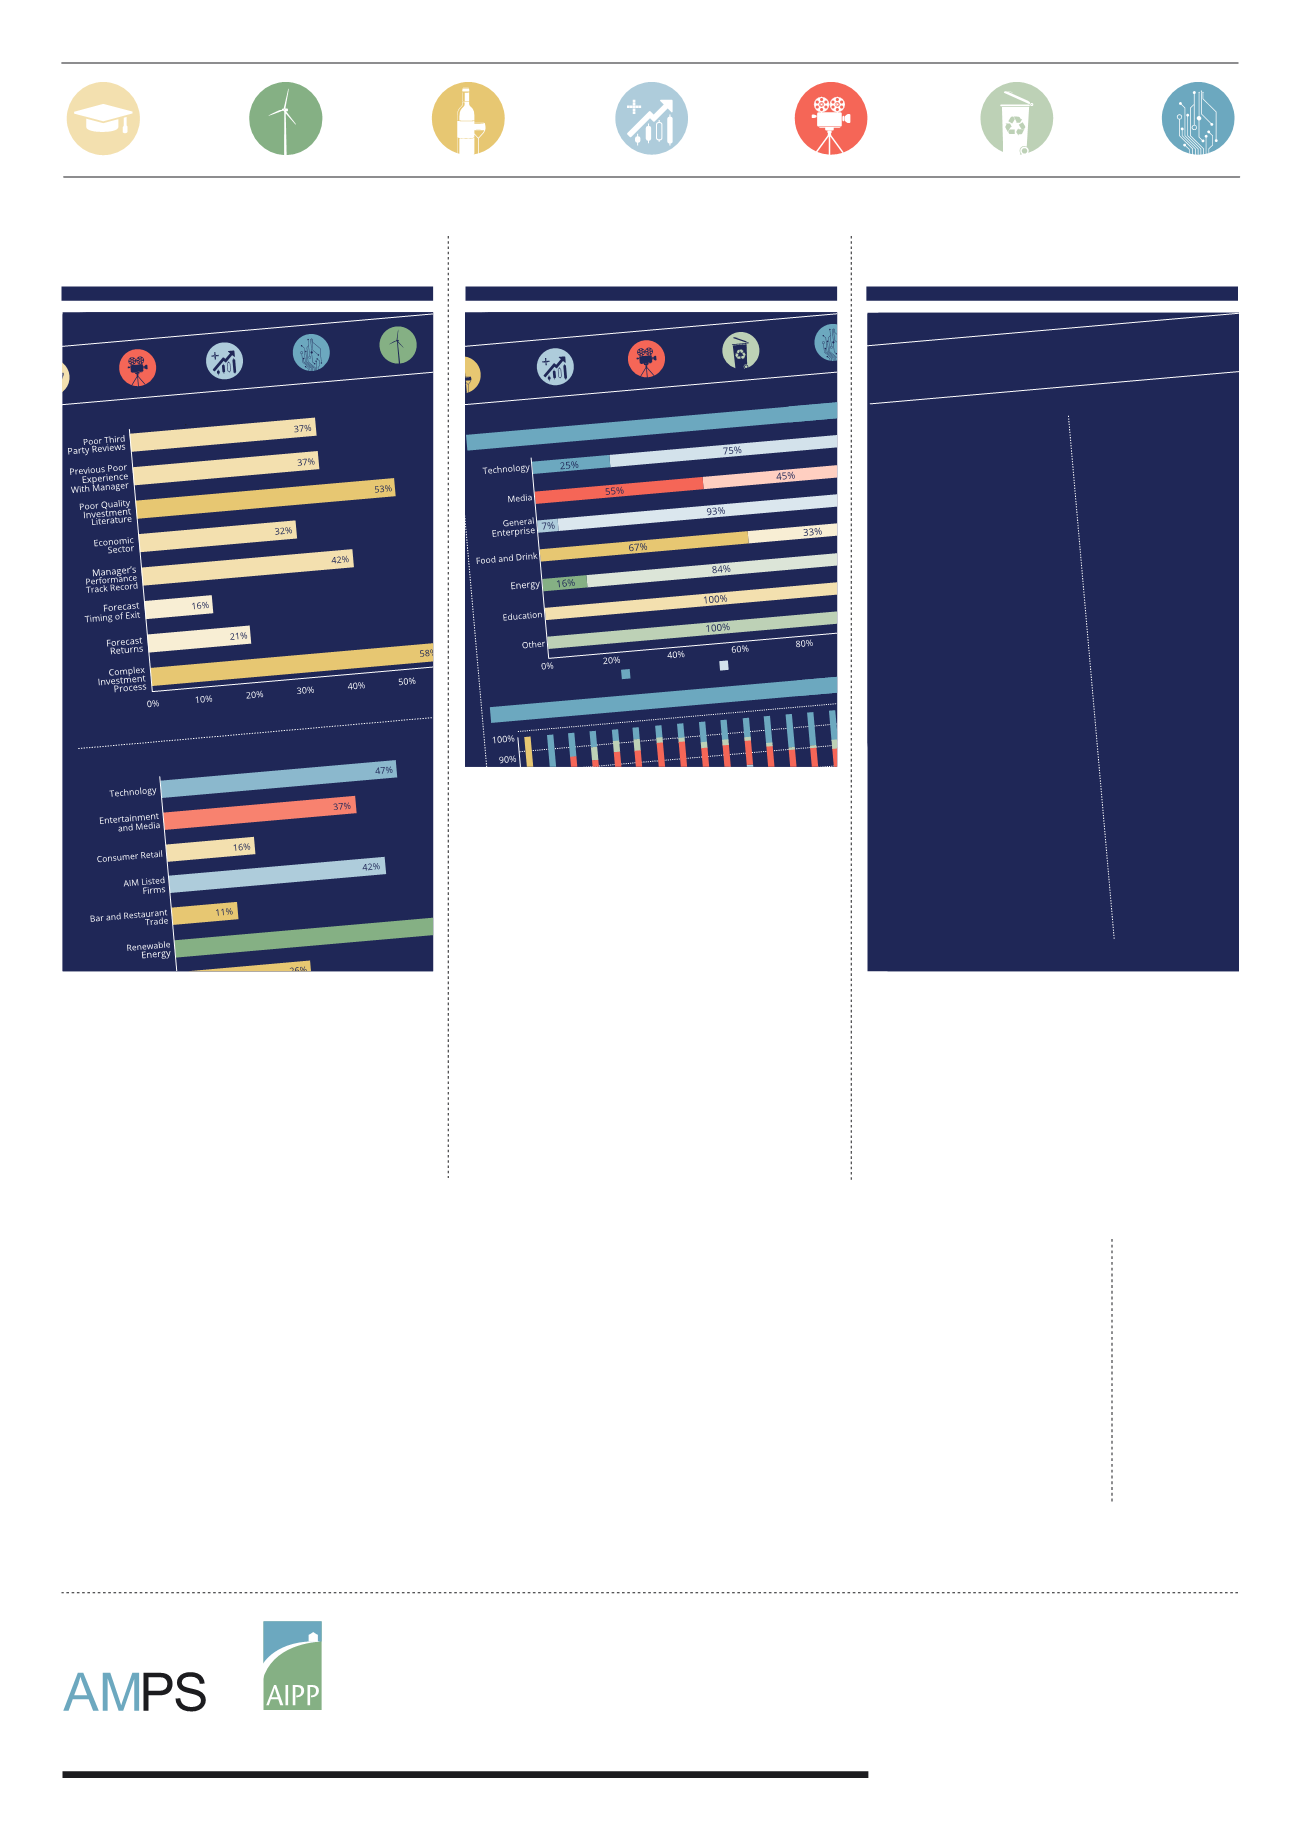
SECTOR SPLIT BY STRUCTURE
The industry sectors can be looked at
in further detail by analysing the split
between single company investments
and managed funds/portfolios.
It is interesting to see that the other
(including transport, sport and construction)
and education sectors are all dominated
by single company investments. It seems
that there are no specialist operators
in these sectors as yet, which suggests
that there isn’t the kind of deal flow
required to merit specialist funds.
The larger sectors generally have a good
mix of both single company and fund
based investments. Funds account for the
highest proportion of investments within
general enterprise accounting for 93% of
the sector, followed by energy with 84%
of the sector and technology with 75%.
Media has a relatively even split with
55% single companies and 45% funds/
portfolios. There are a number of well-
established operators in each of these
sectors with many having launched mor
than one investment, which suggests
both a healthy amount of deal flow and
investor demand – hopefully an indicat
successful investments that have benef
both investors and the companies.
It is also very interesting to see how th
different sectors within the EIS market
have developed over time. The chart o
the right looks at the proportion of th
market each sector accounted for ove
last 16 years. Over time there has be
a reduction in the dominance of sect
such as food and drink and educatio
a large amount of growth in energy,
since 2008 has grown to become the largest
sector. Technology was a dominant
in 1999 leading up to the tech bubbl
market share between 2002 and 20
and has since seen strong growth to once
again become one of the largest se
half dozen years, foo
eral enterprise have
share drop while tec
nergy have all risen.
ergy, technology and general
eighted towards fund/portfo
le company
st sector with
67%
33%
SPLIT OF EIS SECTORS BY INVESTMENT STRUCTURE
HISTORIC MARKET SHARE BY SECTOR
(1998 - 2014)
Single Company
Fund/Portfolio
(1998 - 2014)
MARKET ANALYSIS
CHALLENGES AND LIMI
It is also important to note that
there are some limitations with our
data collection process that have an
impact upon the final analysis.
Firstly, the information included on the
register is limited to those investments that
are openly marketed that we were able to
identify. There is no central register for EIS
investments (we did enquire with HMRC
who are responsible for administering
the tax benefits, but they do not keep a
central register) so ultimately we simply
don’t know what we don’t know – there
could be a number of EIS investments
that are not widely marketed that we
have not captured as part of our analysis
process. However, our view is that
although this information is missing, it is
not essential: if these opportunities are
not widely marketed and available, then
there is no need for them to form part of
most advisers’ and investors’ thinking.
Secondly, unfortunately not all of the EIS
product providers engaged with the data
verification process. Every EIS manager
and provider were given the opportunity
to participate, and it was very encouraging
to receive a high level of support, but
inevitably there were a number of managers
that chose not to participate – perhaps
due to understandable apprehensions
about disclosing commercially sensitive
information for inclusion in a new and
unfamiliar report. Again, we feel that
although this step is missing, it is not
essential. Provided that those managers’
publicly available information was accurate,
then the data in the register will be
accurate. However, the fact that the data
verification second check step was not
comprehensive does increase the possibility
of inaccuracies creeping into the report.
Finally, our data collection process means
that there is an in-built bias towards the
most recent investment opportunities
as these are the easiest to identify and
collect data on. We’re not able to quantify
the impact of this, but logic tells us that it
means that the analysis is more accurate
the later the period we are looking at.
Our hope is that in the future as this report
becomes better established and can show
a track record of helping to grow the EIS
market, more managers will participate
with the data collection exercise.
This will ultimately improve the
scope of the register and accuracy
of the information provided.
GLOSSARY
2014
A
i
R
ALTERNATIVE INVESTMENT REPORT
FSC is a non-profit international organisation established to promote the responsible
management of the world’s forests. Products carrying the FSC label are independently certified
to assure consumers that they come from forests that are managed to meet the social,
economic and ecological needs of present and future generations, and other controlled sources.


