61
that the fees can vary greatly. As with all
debates over fees, it is not necessarily
the case that cheaper is better - it is a
question of value for money - but this
is an area that has not been scrutinised
to date and is sometimes ignored by
advisers.
The initial charges analysed compare
favourably with mainstream investment
fund charges and are lower than their
closest stable mates, EIS products.
This possibly reflects the larger BPR
investment universe and the freedom
from having to source the deal flow (with
all of the associated research and due
diligence) that goes with EIS investing.
The charges for AIM portfolios were in
a slightly tighter range than non-AIM
portfolios, which is logical as the AIM
products are all investing in the same
investment universe, with the same
broad objectives. Initial fees range from
1% to 2.5%, and AMC ranges from 0.75%
to 2.5% with some exceptions – one
provider has a flat initial fee of £250 +
VAT for example.
The majority of investments on the
register have no performance fee.
However the maximum performance
fee was 50% of any increase in the NAV
above 5%. Products with performance
fees had fairly average initial charges
and AMC; however the targeted returns
were in the upper quartile of the overall
market returns. Overall, performance
hurdles range from 3% to 5% of NAV
growth.
AIM focused investments only had one
product with a stated performance fee;
a reflection of the fact that AIM based
products generally don’t target specific
levels of return.
APPLES WITH APPLES?
Comparing the overall cost of
investment between products
(including the initial fee, dealing fee,
AMC, admin fees and performance fees)
can be problematic and a full analysis is
beyond the scope of this report.
As noted above and over the page,
comparing the initial fees and dealing
fees is relatively simple (but still
requires a small amount of leg work),
with most clustered between 2-3% of
the investments NAV.
AMC’s range from zero (the provider
will be charging the investee company)
to 3.5%, but some are applied after
a performance hurdle and some are
not. Some products also charge an
additional administration fee.
Then there are additional performance
fees. Again, these are applied after
a hurdle, and the hurdle is usually
calculated once the other fees have
been accounted for, but this is not
always made clear in the investment
literature. Hurdles range from 3-5%
and performance fees taken above the
hurdle range from 15-50%.
The variety of pricing structures makes
apples with apples comparisons very
challenging and requires access to
detailed charging data that can be
manipulated to compare various
investment scenarios.
Currently MICAP is the only source that
has this data in an easy to compare
format foradvisers to carry out their
own analysis of charges across the
whole-of-market.
OVERALL MARKET
CONCLUSIONS
A
lthough the minimum investment is
high on average, the lowest entry levels
are very affordable, perhaps indicating
that the market is starting to reach out
to a wider group of investors as IHT
becomes a problem for the mass
affluent and not just the high net worth
In theory all of the AIM portfolio
propositions would also be acceptable
within an ISA, providing relief from
income tax as well as IHT, but only 26%
of AIM products market themselves as
ISA’able
The simple, easy and familiar legal
structure of a discretionary managed
fund accounts for 76% of the products
in the market
Although IHT mitigation and capital
preservation are the principal
investment objectives, products that
also target capital growth account for
19% of the market (and the majority of
these are AIM portfolios)
We can speculate that AIM based
BPR products that offer equity levels of
return are more suitable for younger
investors - especially those with large
ISA portfolios
BPR products that focus on unlisted
investments should have lower levels of
volatility and are more likely to quote a
target rate of return
Initial charges are comparable to
other types of tax efficient investments
Charging structures can make
meaningful comparisons difficult.
The variety and complexity of
charging structures can make
comparisons difficult
Dealing fees should be added to
the initial charge to calculate a “cost
of transaction”
Fees to investee companies are
quite opaque, but could impact
investment performance
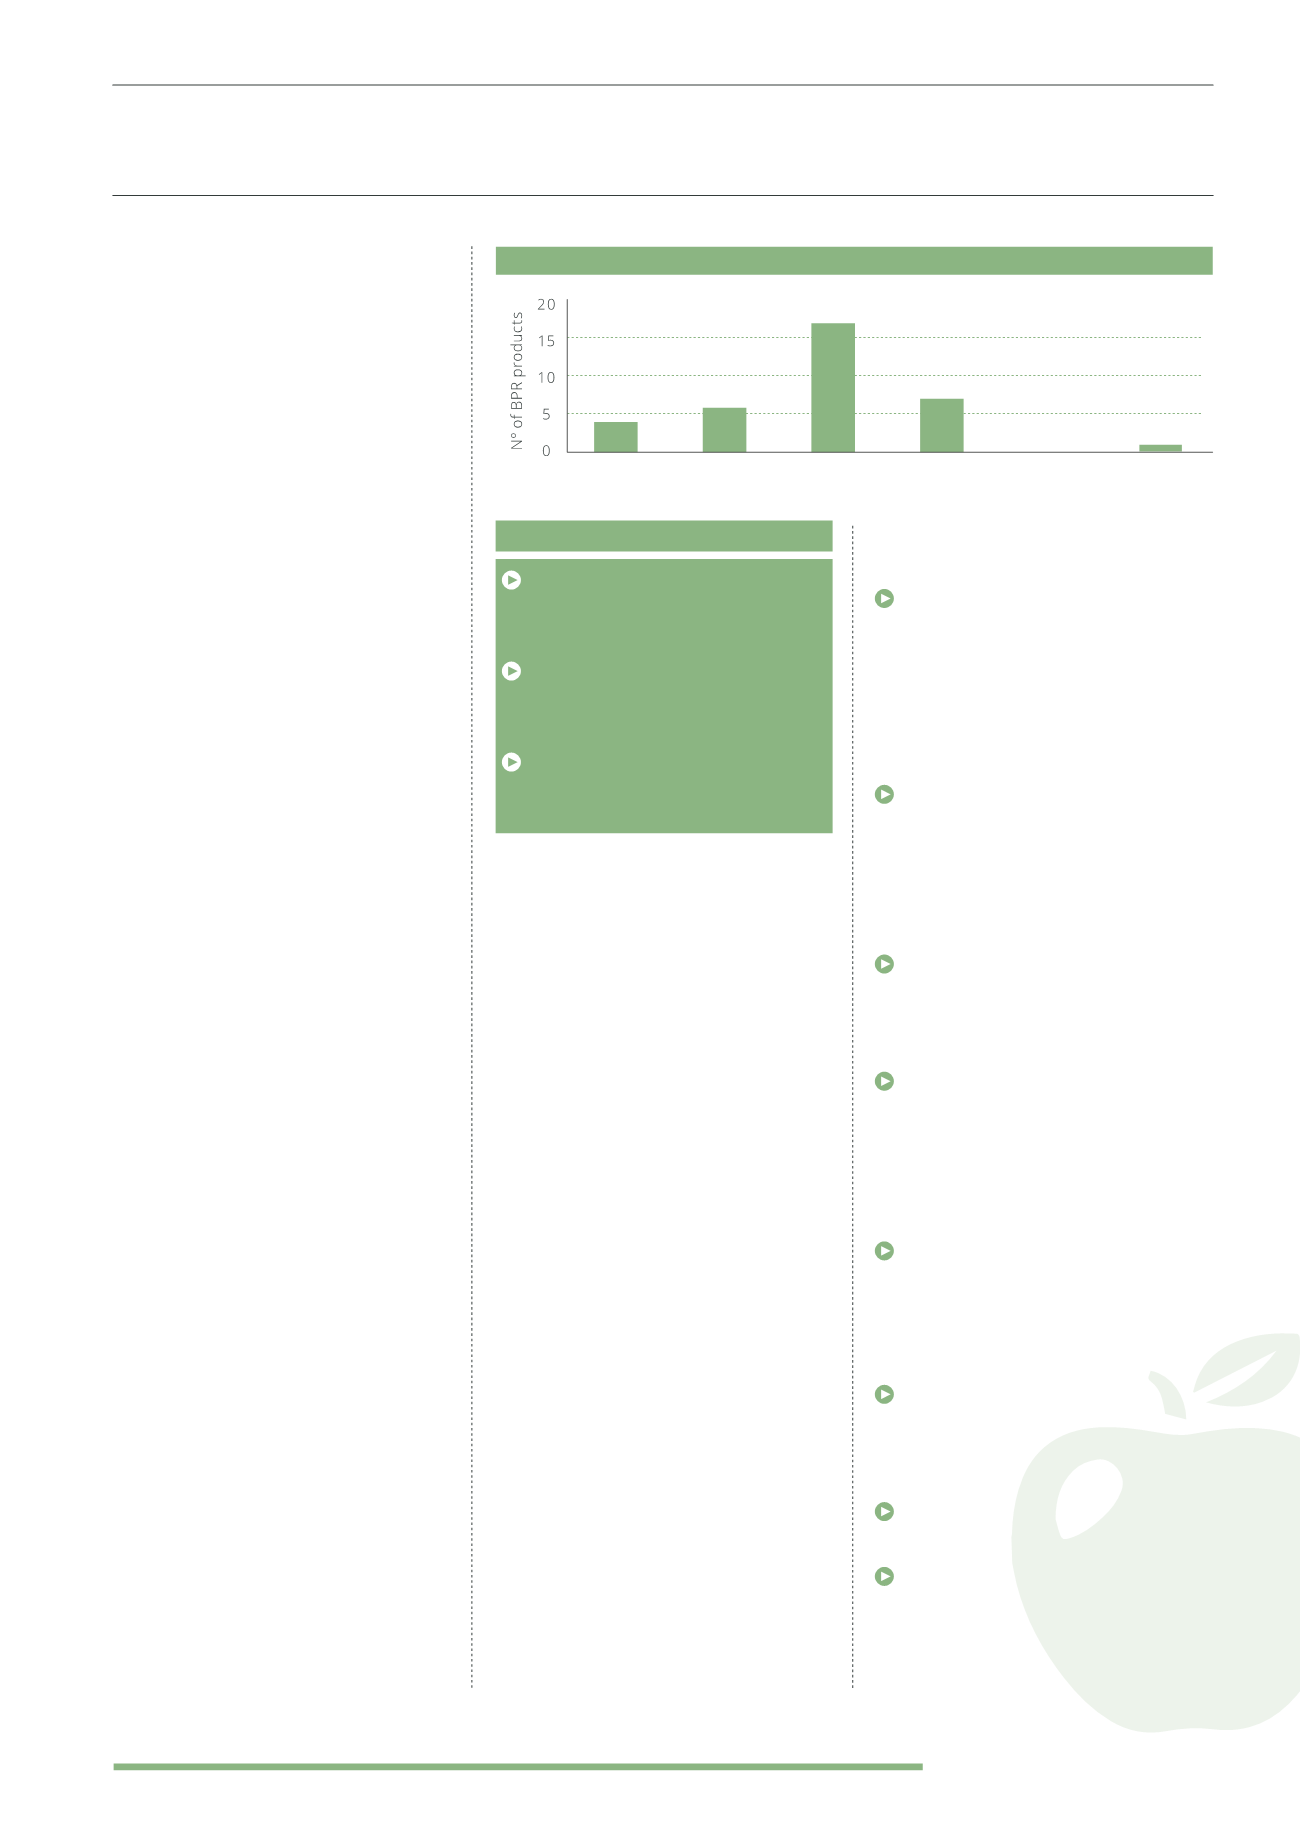
CHARGING RANGES
(INITIAL FEE + DEALING FEE)
0-0.9
%
1-1.9
%
2-2.9
%
3-3.9
%
4-4.9
%
5-5.9
%
“The variety of pricing structures makes apples with apples comparisons very challenging”
KEYPOINTS


