


 18 / 40

18
This has led to a levelling off of iron ore
demand and diminished demand for
coal, and since China’s consumption of
coal accounts for just over 50% of global
use
37
, and it imports almost two-thirds
of the world’s seaborne iron ore, the
Dry Bulk shipping market is presently
very vulnerable to changes in China’s
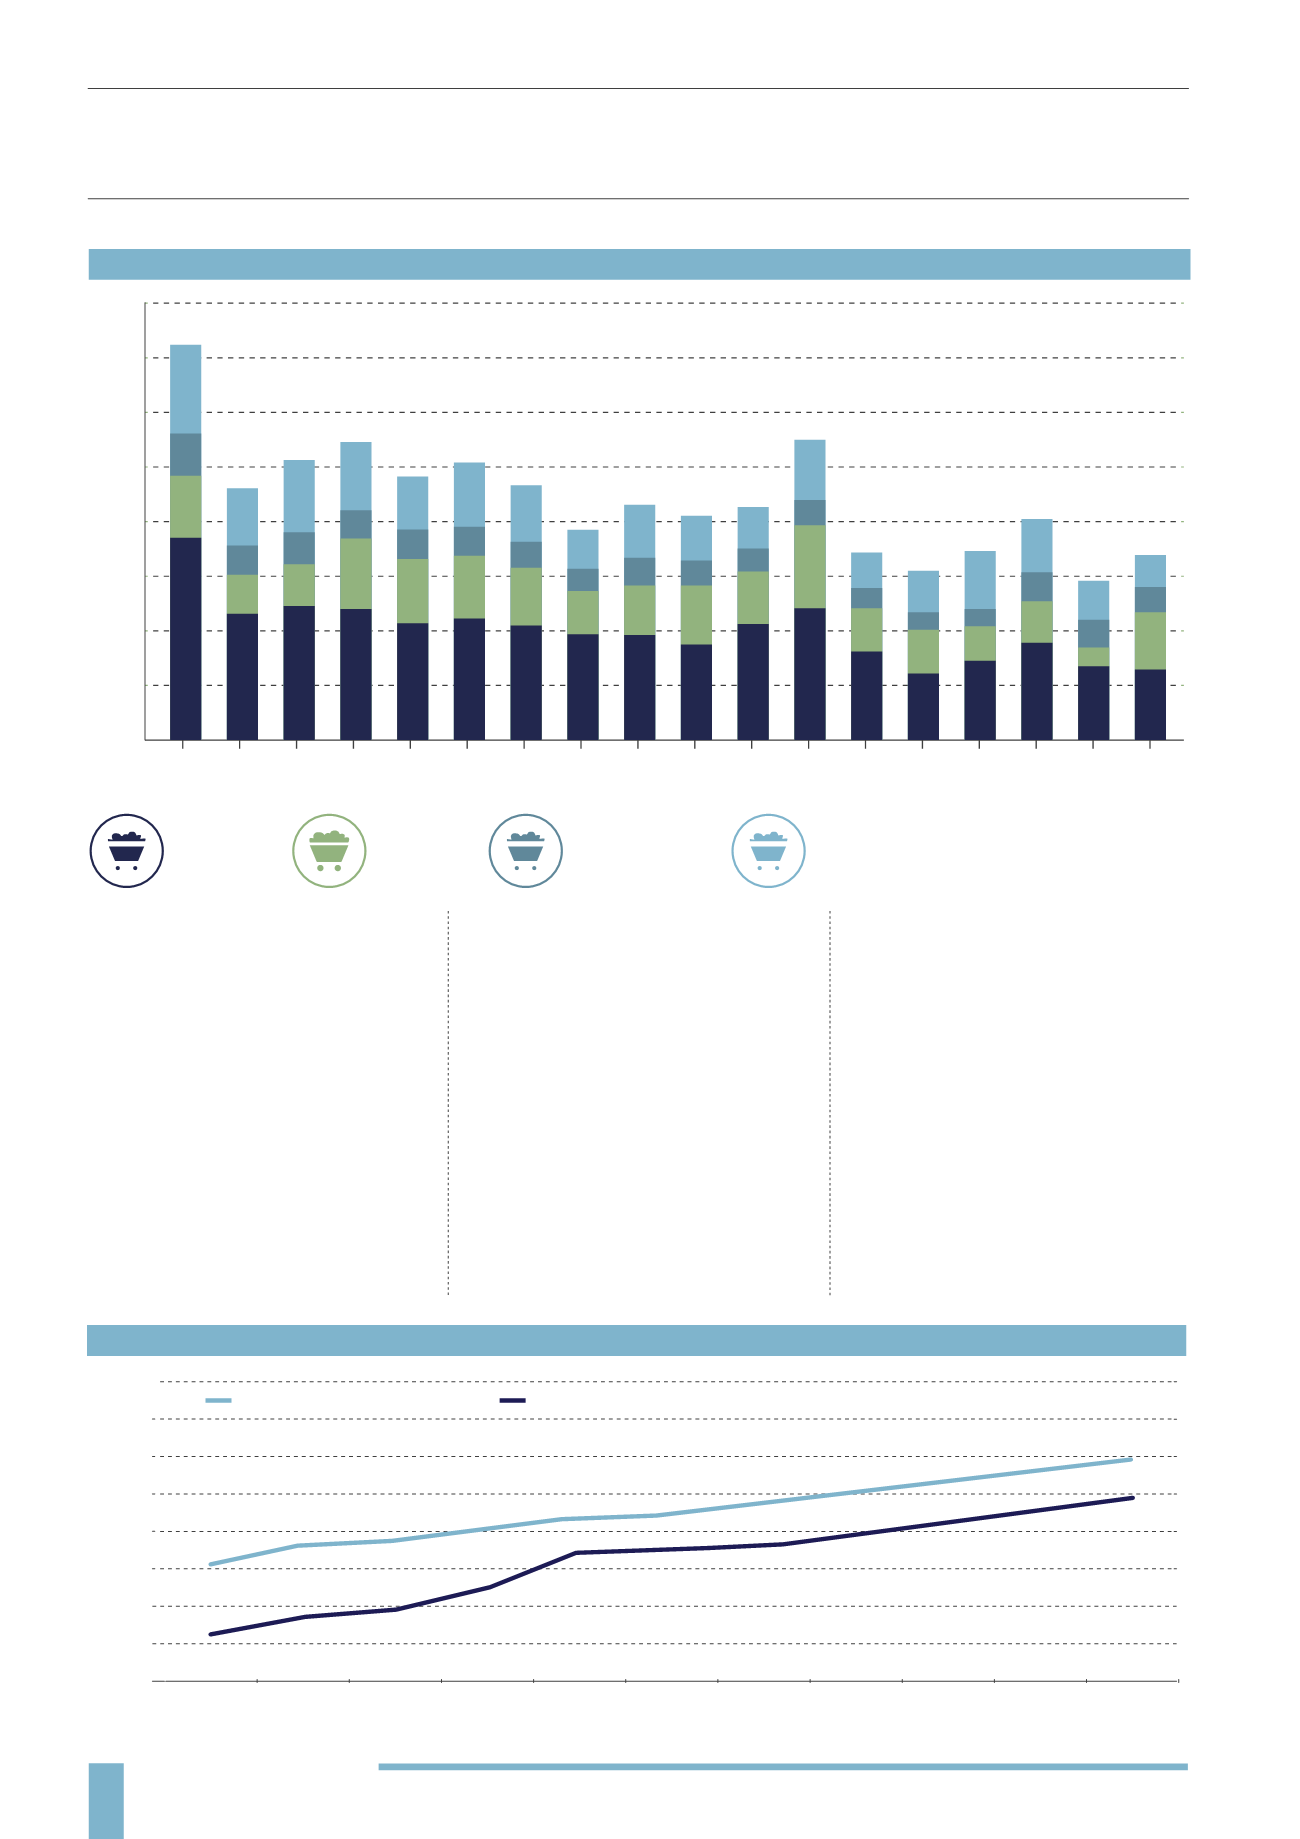
demand. The scale of the problem is
noteworthy: e.g. in the first six months
of 2015 China imported just under
100 million tonnes of coal in total, a
reduction of more than 38% compared
to the same period in 2014.
37
In September 2015, Deutsche Bank
described Chinese coal imports as
being at a new normal and iron ore
imports not growing but steady.
38
In the
same month, Australia & New Zealand
Banking Group Ltd (ANZ) stated, “While
we still see steel demand recovering
mildly in the later part of the decade,
in line with a less sluggish housing
market, we now forecast that peak-steel
consumption occurred in 2014.”
39
However, other Chinese imports are
continuing to grow and a country
with such a massive population will
always command significant demand
in one area or another, particularly as
globalisation continues. Soya beans are
an example. China is the world’s largest
importer, with soya bean imports for
the 2014/15 harvest predicted to reach
a new high of 76 million tonnes, and the
volume for 2015/16 forecast at 77 million
tonnes
40
. Dry Bulk carriers, especially
smaller vessels such as Handysize and
Handymax/Supramax, also enjoy in
excess of 400 million tonnes of the 1
billion tonnes of cargo of all kinds which
is transported between Chinese ports
by sea
9
and there are positive moves
CHINESE COAL IMPORTS BY TYPE
(2014-2015)
“Other Chinese imports are continuing to grow, e.g. Soya beans – China is the world’s largest
importer, with soya bean imports for the 2014/15 harvest predicted to reach a new high of 76
million tonnes”
STEAM
COKING
ANTHRACITE
LIGNITE
Source: BIMCO, China Customs
Jan
2014
Feb
Mar Apr May Jun Jul
Aug Sept
Oct
Nov Dec Jan
2015
Feb Mar Apr May Jun
0
5
10
15
20
25
30
35
40
Millions of tonnes
GLOBAL DEMAND DRIVERS (HISTORIC AND PROJECTED FIGURES)
(2010-2020)
Source: Drewry Maritime Research
Millions of tonnes
2,400
2,400
2,000
1,800
1,600
1,400
1,200
1,000
800
2010
2011
2012
2013
2014
2015
2016
2017
2018
2019
2020
Steel production
Iron ore trade