


 13 / 40

13
for the investment sector which is
closely correlated to wider economic
markets and factors, but also with
potential for substantial gains. This
allocation might form part of a diverse
satellite portfolio of EIS, VCT and other
investments into unquoted companies.
TAX BENEFITS
Tax regimes on maritime activities
in many world-wide jurisdictions
are particularly low and this is also
the case with UK shipping, thanks to
the UK Tonnage tax, which is “a ring-
fenced regime allowing ship-operating
companies to have their taxable profits
from shipping activities determined at
fixed rates, according to the carrying
capacity (tonnage) of the ships in their
fleet. These, rather than the actual
profits, are then subject to corporation
tax in the normal way, producing a
low tax charge that is competitive in
the international shipping markets.
Introduced in 2000, this system reflects
the norm in many other countries
throughout the world and is explicitly
approved under the EU’s state aid
policy. ”
25
This means that Dry Bulk shipping, as a
part of the international shipping fleet,
is not an industry which is subject to
significant taxes on its profits, leaving
a larger element of funds for the
successful upkeep of its vessels, running
of its businesses and preservation of
their capital reserves.
From 2000 to 2011, there was
remarkable growth of shipowners and
operators within the UK. The UK-owned
fleet grew by almost three times, and
the UK-registered fleet – albeit from a
very low base – grew by more than six
times
25
. This has been of major benefit
to the UK economy.
The eligibility of Dry Bulk shipping for
tax efficient investment wrappers such
as EIS and VCT, is also advantageous.
“Shipping is large, is experiencing long-term growth and will recover within private equity’s
three to five year investment horizon”
Wilbur Ross, Private Equity Investor
50%
45%
40%
35%
30%
25%
20%
15%
10%
5%
0%
1980
1986
1992
1998
2004
2010
1983
1989
1995
2001
2007
2013
1982
1988
1994
2000
2006
2012
1985
1991
1997
2003
2009
2015
1981
1987
1993
1999
2005
2011
1984
1990
1996
2002
2008
2014
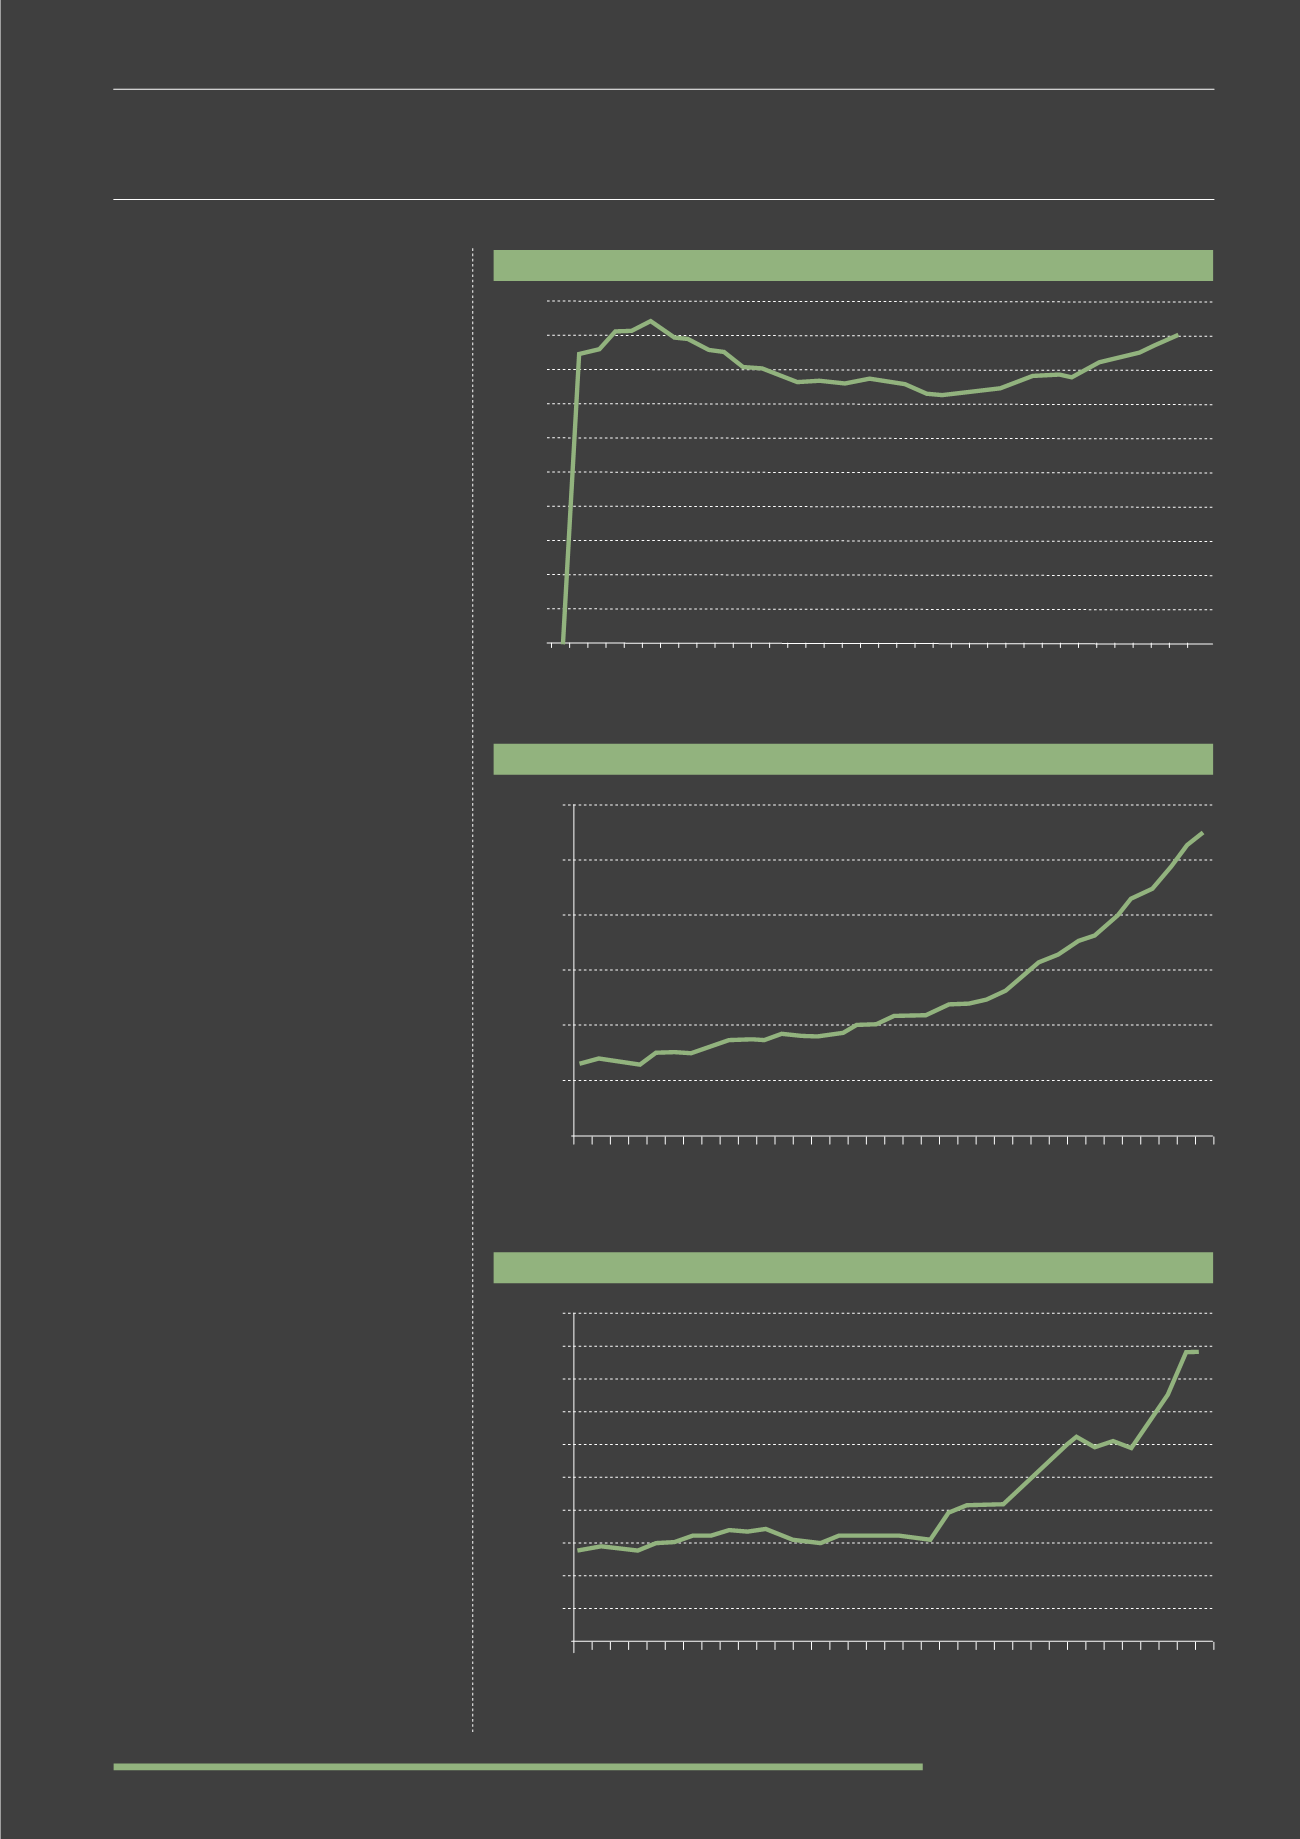
DRY FREIGHT % OF WORLD SEABORNE TRADE
(1980-2015)
TOTAL DRY BULK MAJOR BULKS SEABORNE TRADE
(1980-2014)
TOTAL DRY BULK MINOR BULKS SEABORNE TRADE
(1980-2014)
Source: Drewry Research
9
Source: Drewry Research
9
Source: Drewry Research
9
1980
1986
1992
1998
2004
2010
1983
1989
1995
2001
2007
2013
1982
1988
1994
2000
2006
2012
1985
1991
1997
2003
2009
1981
1987
1993
1999
2005
2011
1984
1990
1996
2002
2008
2014
3000
2500
2000
1500
500
0
1000
1980
1986
1992
1998
2004
2010
1983
1989
1995
2001
2007
2013
1982
1988
1994
2000
2006
2012
1985
1991
1997
2003
2009
1981
1987
1993
1999
2005
2011
1984
1990
1996
2002
2008
2014
50
400
450
500
300
250
200
100
0
50
150
Millions of tonnes
Millions of tonnes