


 17 / 40

17
In recent years, China has been the most important macroeconomic driver of demand in Dry Bulk shipping and the slow-down in
its economic growth has therefore been a significant negative influence on the sector; China has experienced sharp corrections in
its equity markets, weak manufacturing output and reduced growth rates since 2013. The country is targeting 6.5% annual growth
97
for the next five years, which would be the country’s slowest growth pace in the last 25 years
36
. This slow-down has reduced
building rates and additionally, in recent years, the Chinese government has worked hard at implementing more renewable energy
sources such as hydropower, thereby reducing its reliance on coal, which has traditionally generated 70% of China’s energy
37
.
said that, according to the IMF’s April
2015, World Economic Outlook, “Global
growth remains moderate, with uneven
prospects across the main countries
and regions. It is projected to be 3.5% in
2015. Relative to last year, the outlook
for advanced economies is improving,
while growth in emerging market and
developing economies is projected to
be lower, primarily reflecting weaker
prospects for some large emerging
market economies and oil-exporting
countries. The International Monetary
Fund outlook also points out that,
“Asia’s growth is forecast to hold steady
in 2015, and the region is expected to
continue outperforming the rest of the
world over the medium term. While the
Chinese economy is shifting to a more
sustainable pace, growth is projected to
pick up elsewhere in the region.”
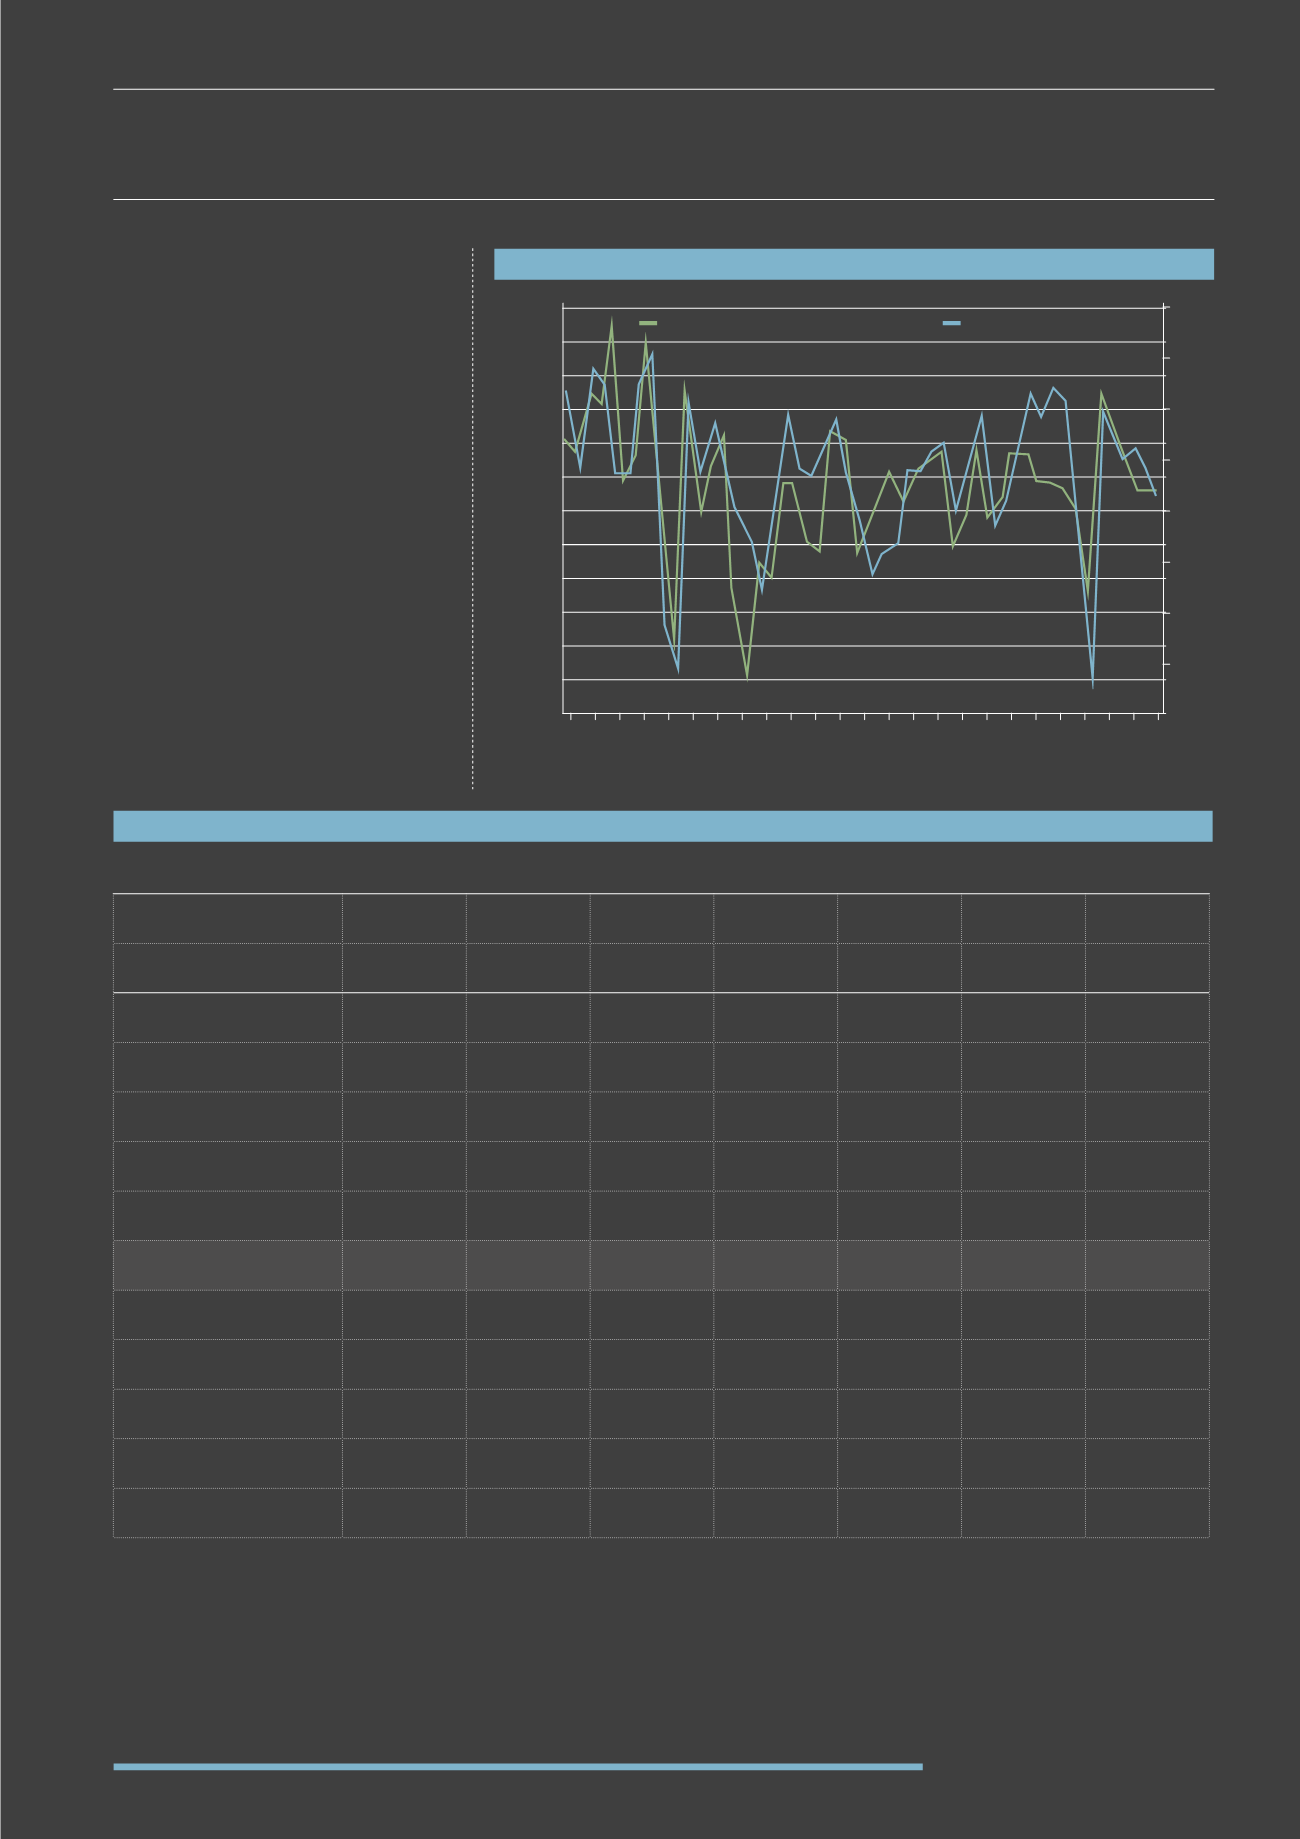
CORRELATION BETWEEN GDP AND SEABORNE TRADE GROWTH
HISTORIC AND PROJECTED GDP GROWTH
(% CHANGE PREVIOUS PERIOD)
(2010-2016)
% Trade Growth YOY
% GDP Growth YOY
2010
2011
2012
2013
2014
2015
(expected)
2016
(expected)
GLOBAL ECONOMY
5.2
3.9
3.5
3.1
3.1
3.5
3.8
INDUSTRIAL WORLD*
2.8
1.6
1.7
1.3
1.6
2.1
2.0
USA
2.5
1.8
2.8
2.2
2.1
2.8
2.3
EUROPE
2.0
1.7
-0.3
-0.4
0.8
1.2
1.7
GERMANY
3.9
3.4
0.9
0.1
1.4
1.5
1.8
FRANCE
1.7
2.0
0.3
0.4
0.4
1.0
1.6
JAPAN
4.7
-0.5
1.4
1.5
0.8
0.8
0.7
UK
1.7
1.1
0.3
1.7
3.1
2.7
2.5
EMERGING ASI A
9.7
7.9
6.7
6.1
6.0
6.3
6.5
CHINA
10.4
9.3
7.7
7.7
7.3
6.5
6.5
INDI A
10.3
6.6
4.7
4.7
5.3
6.3
6.8
KOREA
6.3
3.7
2.0
3.0
3.6
4.1
4.0
LAT IN AMER ICA* *
6.0
4.6
2.9
2.5
1.1
1.9
2.8
Source: Drewry
21
Source: ICS and UNCTAD
“The average age reduction is around 4 to 5 years since 2011, with Handymax and Supramax
falling from 30.6 to 26.6 years”
34
Drewry Maritime Research, Dry Bulk Forecaster | 3Q 2015
7%
14%
6%
12%
5%
10%
4%
8%
3%
6%
2%
4%
-4%
1%
2%
-6%
0%
0%
-8%
-1%
-2%
-10%
1966
1982
1998
1968
1984
2000
1970
1986
2002
1972
1988
2004
1974
1990
2006
1976
1992
2008
1978
1994
2010
1980
1996
2012
2014
Seaborne trade
World GDP
*
G10
**
Latin America and Caribbean