


 22 / 40

22
OPERATING EXPENSES
Operating expenses (OPEX) are
remarkably stable within the Dry Bulk
shipping sector. Year on year, opex
actually decreased by 0.6% to October
2015 and in the years from 2000 to 2014
it increased at a relatively low average
of 3.9% per year
47
. Moreover, predicted
increases over the four years following
2015 are not substantial.
The highest proportion of OPEX is
made up of crew costs, which account
for almost 50%, almost four times as
much as repairs and maintenance.
The opex elements are crew, (around
48%), administration (around 16%),
repairs and maintenance (around 13%),
insurance (around 13%) and stores
(around 10%). These vary by ship type
48
.
The price of fuel is only for the account
of the ship owner under certain charter
types, with those who choose to charter
their vessels under a time charter
generally passing responsibility for the
cost of bunkers (fuel in shipping terms)
to the charterer.
SHORT-TERM OUTLOOK
In September 2015 Bimco
49
viewed
charter rate increases from July and
August as being of major assistance
to dry bulk carriers, allowing them
to achieve the break-even point
and providing breathing room for
companies with large newbuilding
acquisition programmes. For some
time before this, those companies
had been operating their vessels at
a loss. Consequently, in such a harsh
trading environment, Bimco’s cautious
prediction for a return to profit is 2017.
Nevertheless, the cycle is so sensitively
balanced that even a suggestion of
recovery could have detrimental effects
by deincentivising ongoing scrappage,
jeopardising the reduction in vessel
over-supply and thereby delaying a
more pronounced upturn.
Drewry shares the forecast of 2017
as the year of recovery, stating in
September 2015 that, “The Dry Bulk
shipping market will remain in recession
2015
OPERATING
COSTS
(US$PD)
$4,990
$5,460
$6,390
$6,670
$7,270
$8,160
HANDYSIZE
SUPRAMAX
PANAMAX
POST PANAMAX
CAPESIZE
VLOC
Million US$
Source: Drewry Maritime Research
34
HISTORIC & PROJECTED OPERATING COSTS
(US$ PER DAY)
2013 2014 2015 2016 2017 2018 2019
HANDYSIZE
(26-28,000 dwt)
4,880 4,920 4,990 5,080 5,190 5,290 5,390
SUPRAMAX
(55,000 dwt)
5,380 5,410 5,460 5,570 5,680 5,800 5,870
PANAMAX
(65-73,000 dwt)
6,270 6,300 6,390 6,500 6.630 6,750 6,870
P.OST
PANAMAX
(95,000 dwt)
6,550 6,570 6.670 6,780 6,930 7,060 7,170
CAPESIZE
(140-160,000dwt)
7,060 7,180 7,270 7,400 7,560 7,690 7,810
VLOC
(220,000 dwt)
7,950 8,050 8,160 8,300 8,490 8,630 8,790
Source: Drewry
9
Source: Drewry
9
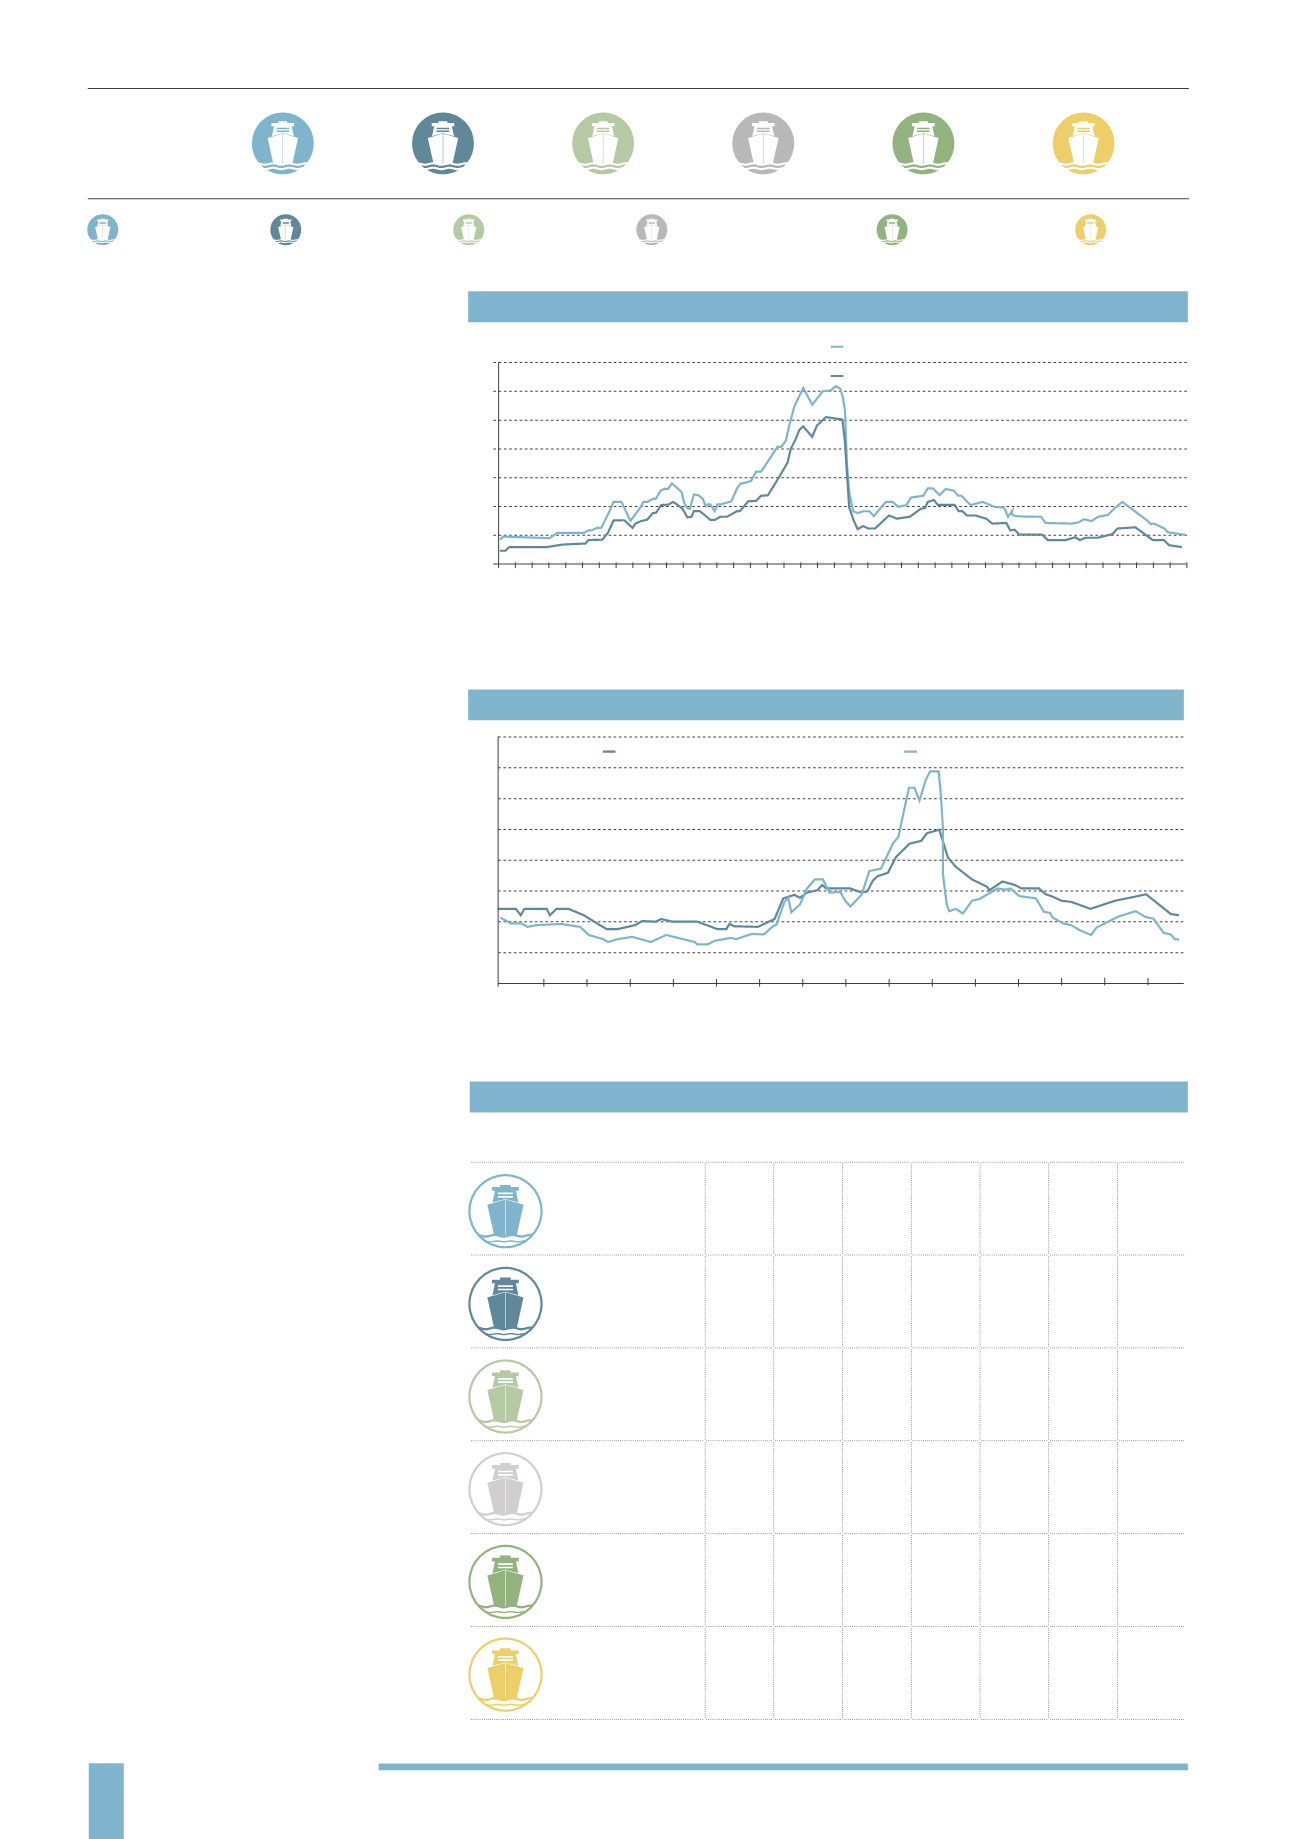
HANDYMAX NEW AND 5 YEAR SECOND HAND PRICES
(US$)
HANDYMAX SECOND HAND PRICES
(US$)
(2001-2015)
2001 Nov
2002 Mar
2002 Jul
2002 Nov
2003 Nov
2003 Jul
2003 Nov
2004 Nov
2004 Jul
2004 Nov
2005 Mar
2005 Jul
2005 Nov
2006 Mar
2006 Jul
2006 Nov
2007 Mar
2007 Jul
2007 Nov
2008 Mar
2008 Jul
2008 Nov
2009 Mar
2009 Jul
2009 Novl
2010 Mar
2010 Jul
2010 Nov
2011 Mar
2011 Jul
2011 Nov
2012 Mar
2012 Jul
2012 Nov
2013 Mar
2013 Jul
2013 Nov
2014 Mar
2014 Jul
2014 Nov
2015 Mar
Handymax 52K 10 year old second hand
Handymax new
Handymax second hand 5 years
Handymax 45-48K dwt 15 year old second hand
Million US$
0
10
20
30
40
50
60
70
Jan 96
Apr 97
Jul 98
Oct 99
Jan 01
Apr 02
Jun 03
Oct 04
Jan 06
Apr 07
Jul 08
Oct 09
Jan 11
Apr 12
Jul 13
Oct 14
0
10
20
30
40
50
60
70
80