


 20 / 40

20
VESSEL VARIATIONS
“Ship demand is determined
by the overall volumes of
cargo moved and the distance
that these are shipped (that is,
tonne mile demand), as well as
changes in vessel efficiency”
43
Scorpio Bulkers Inc. 2014 Annual Report
VESSEL TYPES
It is worth noting that income earning
potential for different classes of Dry
Bulk vessels can differ greatly as they
are exposed to differing supply and
demand factors, with more over-supply
being experienced in some types than
others and more or less reliance on
certain commodities which may or may
not be suffering demand dips.
For 2015, Supramax vessels have
achieved the higher earnings within
the sector, with September 2015
seeing Supramax average earnings
for a single voyage of $9,228/day and
tripcharter average earnings at $8,438/
day
44
. However, with average running
costs at around $5000 to $6000/day
45
,
that leaves narrow margins to cover
unforeseen costs. It also means that
operators with debt may not have
sufficient margin to cover interest and
fees on the debt.
CHARTER RATES
Whilst the volatility of Dry Bulk charter
rates is clear, this applies differently
“Income earning potential for different classes of Dry Bulk vessels can differ greatly as they are
exposed to differing supply and demand factors”
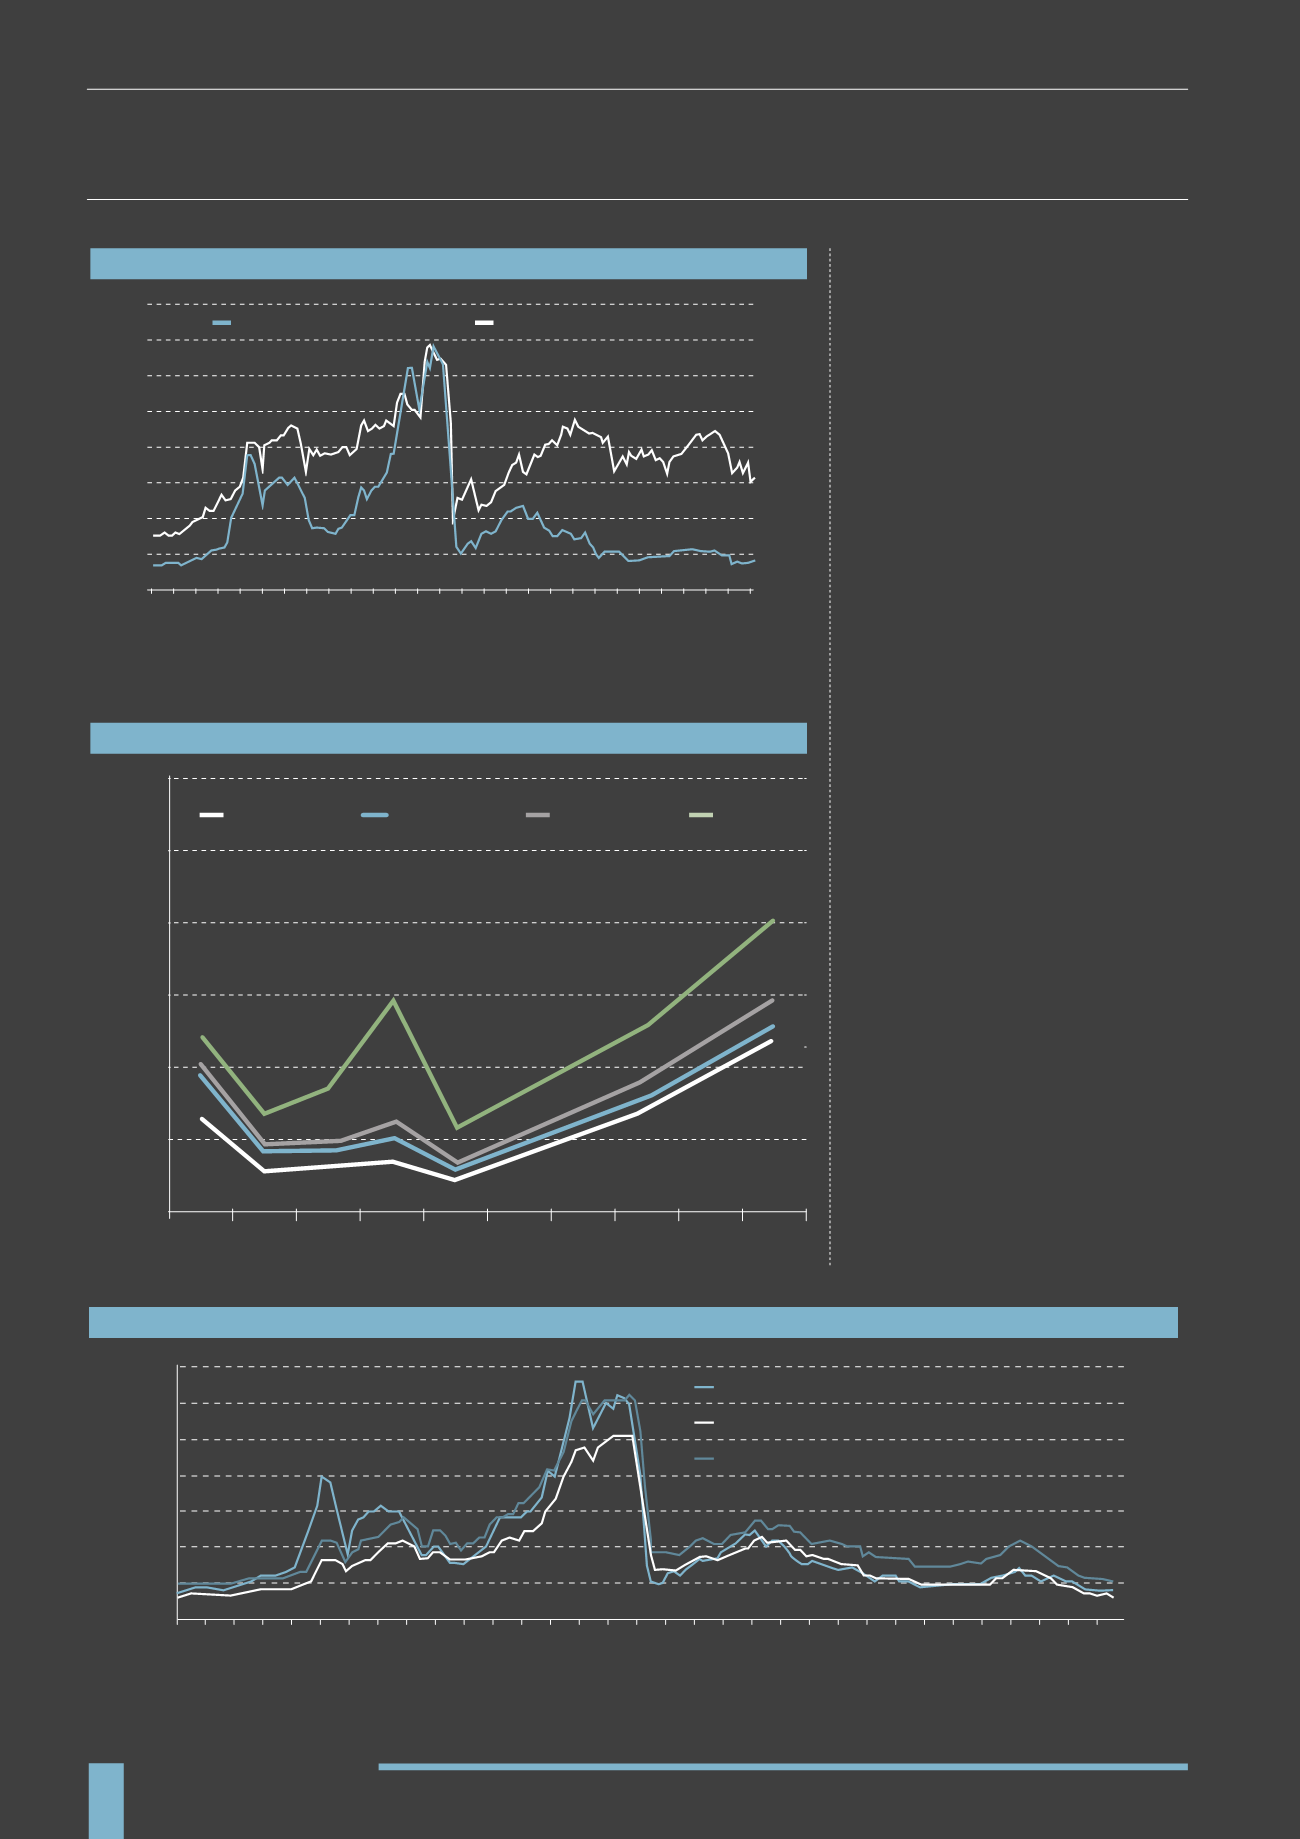
HANDYMAX SCRAP VALUES VS TIME CHARTER RATES
HISTORIC & FORECAST PERIOD RATES
(US$ PER DAY)
(2011-2020)
2011
35,000
30,000
25,000
20,000
15,000
10,000
5,000
2012 2013 2014 2015 2016 2017 2018 2019 2020
Handysize
Handymax
Capesize
Panamax
Source: Drewry Maritime Research
34
US$ per day
CORRELATION OF SECOND HAND PRICES AND CHARTER RATES
(2002-2015)
Source: British Marine
1 Year timecharter rate 52,000 dwt bulkcarrier
Handymax 52k 10 year old second hand prices
Handymax 45-48k dwt 15 year old second hand prices
70,000
60,000
50,000
40,000
30,000
20,000
10,000
0
70
60
50
40
30
20
10
0
2002 - Jan
2007 - Jan
2012 - Jun
2003 - Sep
2009 - Feb
2014 - Feb
2005 - May
2010 - Oct
2002 - Nov
2008 - Apr
2013 - Apr
2004 - Jul
2009 - Dec
2014 - Dec
2006 - Mar
2011 - Aug
2002 - Jun
2007 - Jun
2012 - Nov
2004 - Feb
2009 - Jul
2014 - Jul
2005 - Oct
2011 - Mar
2003 - Apr
2008 - Sep
2013 - Sep
2004 - Dec
2010 - May
2015 - May
2006 - Aug
2012 - Jan
Timecharter Rate ($/day)
Second hand prices (US$m)
80
8
2002 Jan
2002 Jul
2003 Jan
2003 Jul
2004 Jan
2004 Jul
2005 Jan
2005 Jul
2006 Jan
2006 Jul
2007 Jan
2007 Jul
2008 Jan
2008 Jul
2009 Jan
2009 Jul
2010 Jan
2010 Jul
2011 Jan
2011 Jul
2012 Jan
2012 Jul
2013 Jan
2013 Jul
2014 Jan
2014 Jul
2015 Jan
2015 Jul
70
7
60
6
50
5
40
4
30
3
20
2
10
1
0
0
Charter Rate per day (US$ Millions)
Scrap Values (US$ Millions)
1 year Time Charter rate
Handymax Bulker Scrap Value
Source: Drewry
9