


 19 / 40

19
being made by the government, with the
Chinese central bank cutting interest
rates, improving bank lending tools to
boost economic activity, introducing new
stimulus measures to fund construction
projects and devaluing the yuan to
increase export competitiveness.
41
Whilst the knock-on effects of economic
and political movements in China have
proved to be an unwanted and frankly
huge drag on the Dry Bulk market, it is
certainly not the only country to impact
trade, with India filling a meaningful
portion of the demand gap for coal left
by China
33
and the growing requirements
of both developed and developing
nations, including Japan and Vietnam
34
,
for increasing amounts of electric power.
For coal, the main exporters are Australia,
South Africa, Russia, Indonesia, United
States, Colombia and Canada. The main
importers are Europe, Japan, South Korea,
Taiwan, India and China.
Indeed, the supply of ships versus
the demand for the movement of
commodities is predicted to show
demand outstripping supply by 2018 for
some Dry Bulk sectors.
In the short term, iron ore and coal shipments from China have actually been boosted by the slowdown in steel consumption within
China, as mills have sought to find overseas buyers for their output
39
and in the longer term, the use of these commodities in the
production of steel is an important factor, with Dr Edwin Basson, Director General of the World Steel Association saying that, “For the
past decade, the steel industry was dominated by events in China. The evidence is that the steel industry is now entering a period of
pause before undoubtedly picking up again when markets other than China drive new demand.”
42
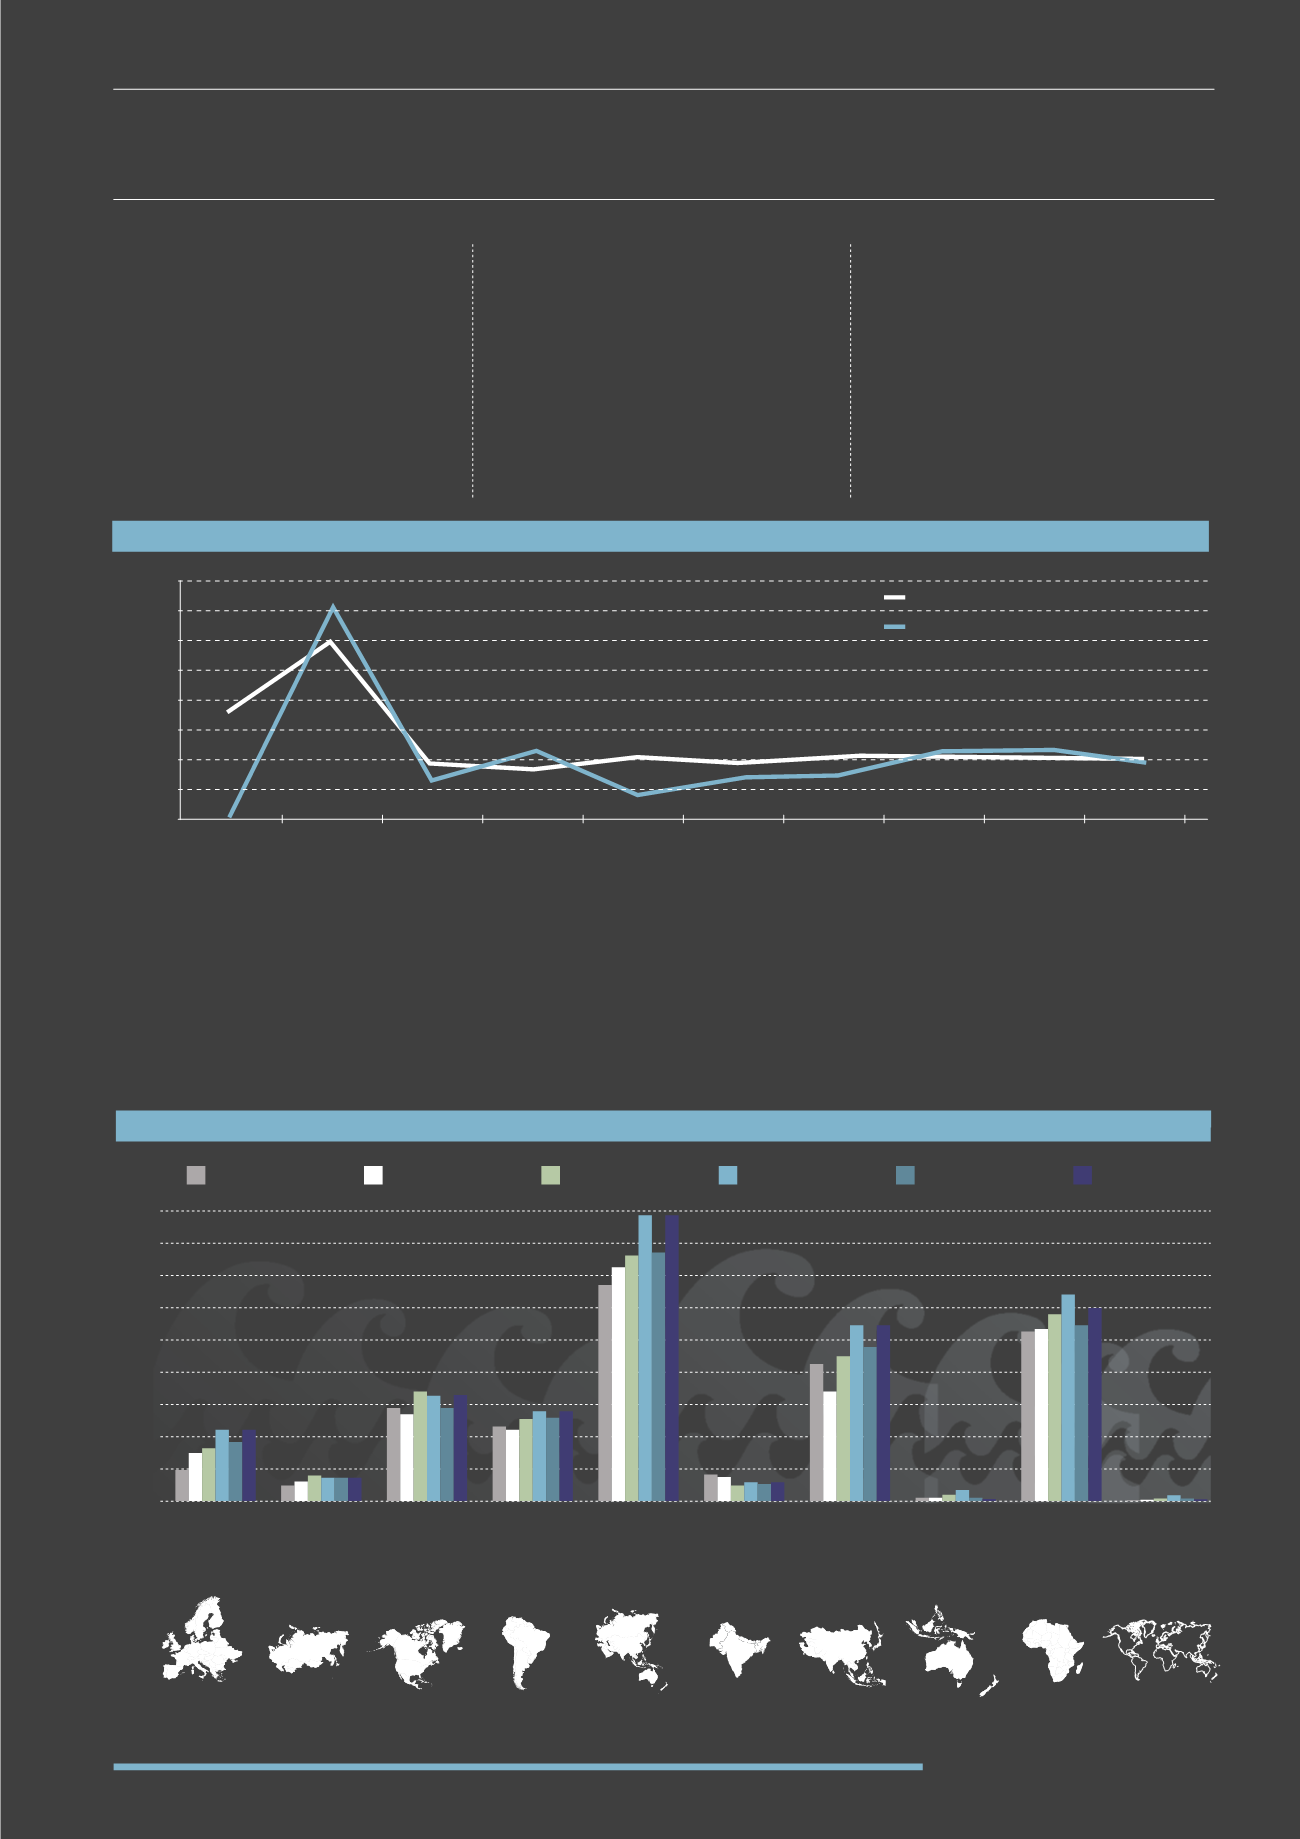
For other commodities such as grains, international demand continues to be strong with wheat exports from the Black Sea countries
projected at record levels in 2015/16, much of which is destined for the Middle East and North Africa.
33
“The Bulk Shipping market is presently very vulnerable to changes in China’s demand”
HANDYMAX HISTORIC & FORECAST SUPPLY/DEMAND GROWTH
(2011-2020)
Source: Drewry Maritime Research
34
40
35
30
25
20
15
10
5
0
2011
2012
2013
2014
2015
2016
2017
2018
2019
2020
Growth in demand
Growth in supply
Millions dwt
MAJOR GRAINS IMPORTS
(2009-2014)
EUROPE CIS
N&C
AMERICA
SOUTH
AMERICA
PACIFIC
ASIA
SOUTH
ASIA
NE
ASIA OCEANIA AFRICA OTHERS
90
80
70
60
50
40
30
20
10
0
2009
2010
2011
2012
2013
2014
Millions of tonnes
Source: Drewry Dry Bulk Forecaster 3Q 15
34