25
Since this change, increased inflows
into AIM funds and BPR products have
been reported - but nobody should
be under any illusion that AIM shares
are comparable with the traditional
shares held in a stocks and shares ISA.
Great care needs to be taken to ensure
that clients understand the difference,
especially when investing as part of an
estate planning strategy.
GROWTH & RETURNS
/
ACCESS TO FUNDS
(REGULAR WITHDRAWAL)
There is a dilemma choosing between
the potential for higher levels of growth,
which necessitate a longer investment
time frame, and ease of access to the
investment funds, which is one of the
selling points of BPR as an IHT solution.
Several managers actually shape their
service to address this issue by offering
a range of portfolios for investors - so
investors can choose to sacrifice returns
in exchange for more liquidity by
investing in the appropriate portfolio.
Liquidity can be provided by holding
cash, selling assets or matching
redemptions with new investments.
SPECIALIST / GENERALIST
Another distinction is the sector that
BPR investment managers choose to
invest in. Some investment managers
are generalists (usually focused on
AIM shares) and some are specialists,
investing in an area of particular
expertise (usually focused in unlisted
assets). Some do a bit of both.
Of course, generalists will argue that
fundamental security analysis and stock
picking is the same whatever sector the
company operates in - and this is why
generalists focus on AIM. A generalist
ought to provide greater levels of
diversification within their portfolio
and has a bigger universe of potential
investment and more deal flow. There is
less chance of them struggling to place
the money in the right opportunity.
On the other hand, specialists can
leverage many years of relevant
experience to find good value
opportunities, they can use their
experience to help guide investee
companies and they can afford to manage
a smaller portfolio more closely to ensure
it remains within the BPR qualifying rules.
CARE
Some managers have recognised that
one of the big drivers for investors
choosing BPR over other IHT solutions
is they want the option to access the
funds at a later date in order to pay for
long term care. Products are structured
specifically to address this need, which
seems a sensible backstop for investors
who are concerned with this issue and
can afford it.
SUMMARY
Despite managers using a narrow
range of similar legal structures and
despite them all having the same broad
objectives of capital preservation,
IHT mitigation and low risk growth,
there is in fact a lot of differentiation
between the products. The two biggest
distinctions are between AIM portfolios
and investments in non-listed assets
and partnerships; and between
specialists and generalists. It is a little
surprising to see so much variety in this
small part of the investment universe,
but perhaps, freed from the tyranny
of quarterly and annual performance
figures, benchmarks, peer groups
and the pressure to generate market-
beating returns this is a space where
managers can be more creative with
their strategies.
10.2
%
14.6
%
12.9
%
3.6
%
3.5
%
2.2
%
1.6
%
0.4
%
1.4
%
1.4
%
1.6
%
0.1
%
13.8
%
4.9
%
0.4
%
7.3
%
2.2
%
15
%
20
%
AIM MARKET COMPOSITION
(April 2015)
3000
2500
2000
1500
1000
500
0
“Whilst the demand for BPR solutions has increased, investors in this market remain understandably risk-
averse; therefore the ability for BPR solutions to be transparent and simple to understand has never been
more important”
Richard Cook, Blackfinch Investments
The AIM market is a stock-pickers market
Source: Personal Social Services Research Unit
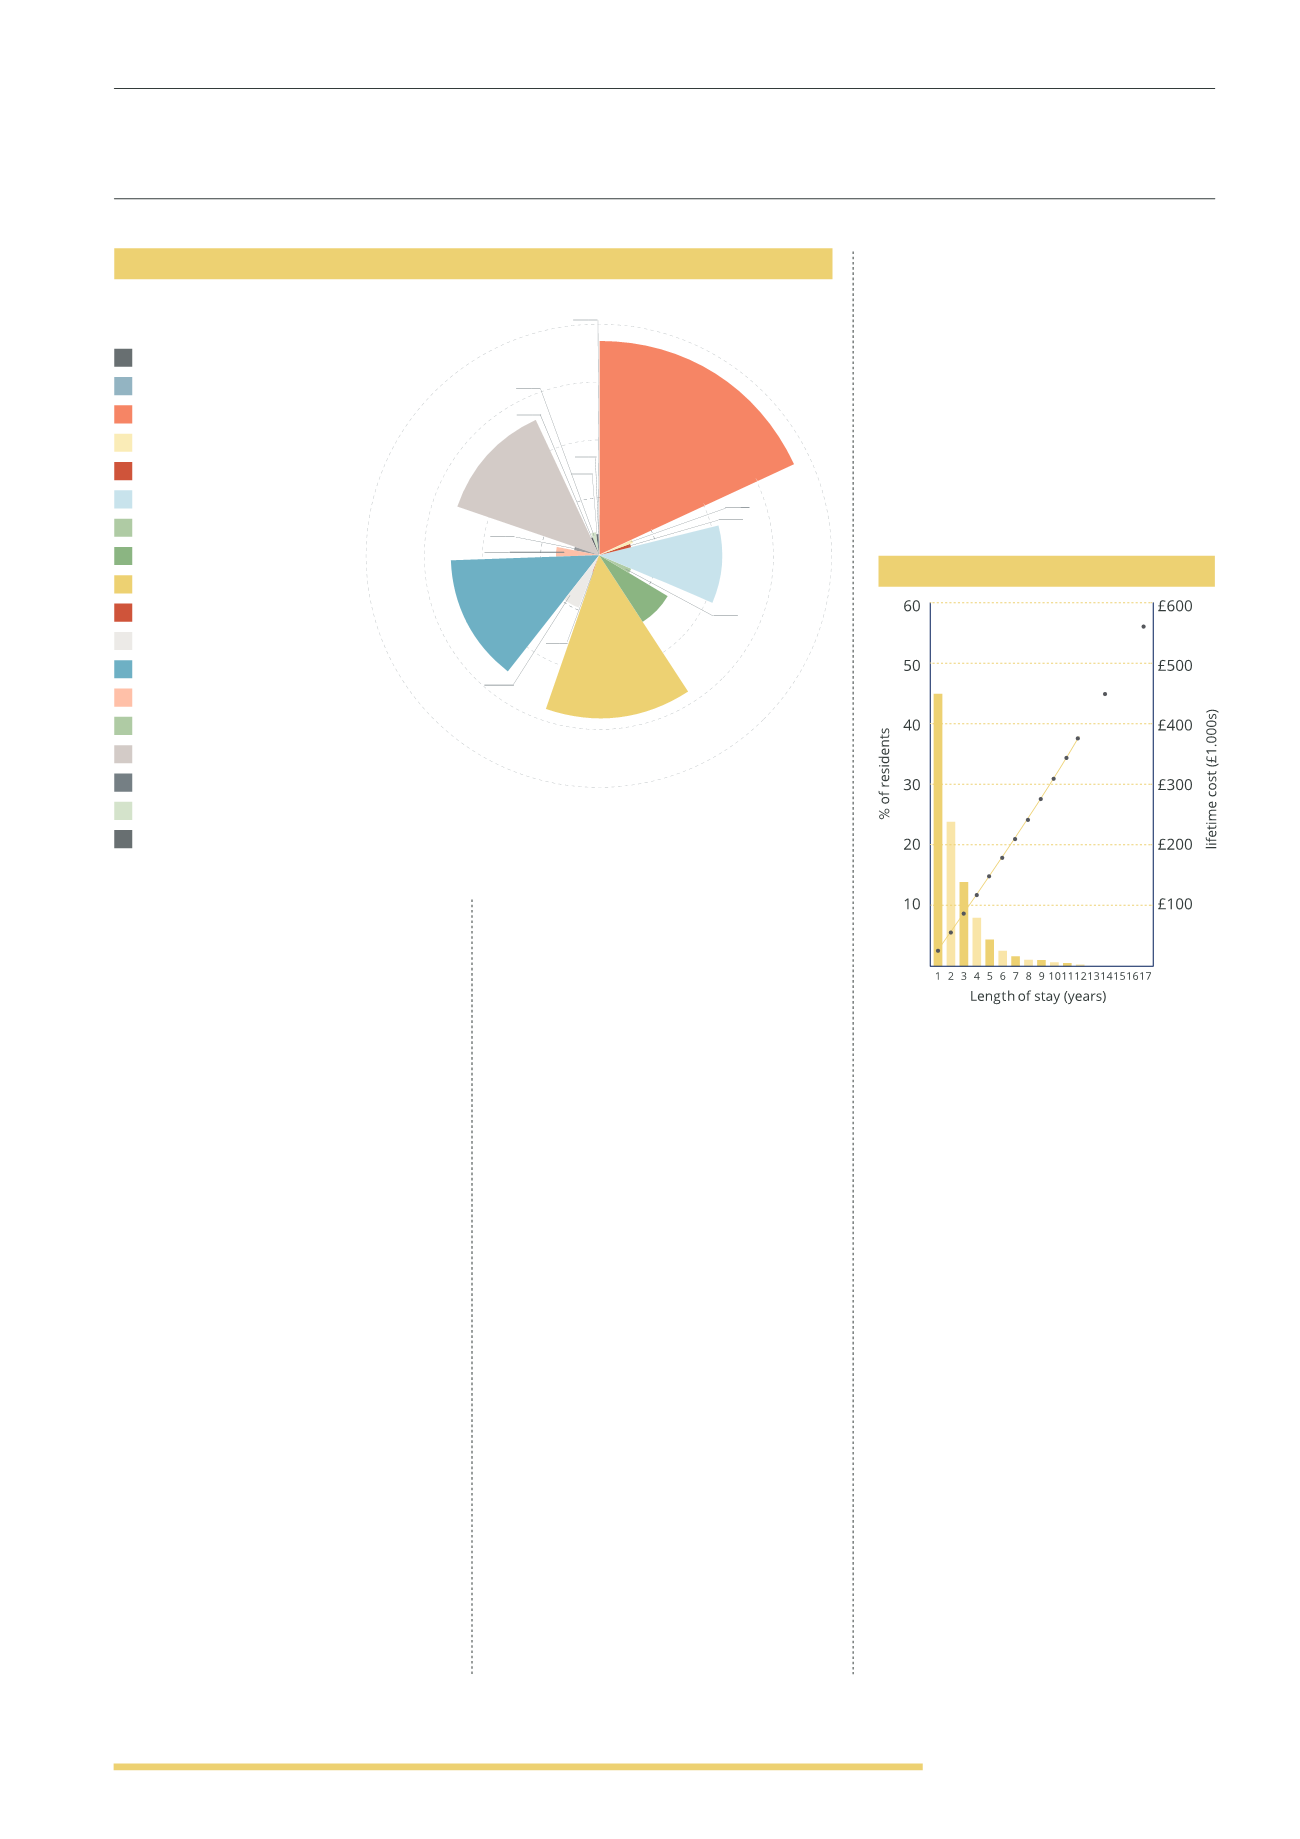
LENGTH OF STAY
Source: London Stock Exchange
Cost of long term care costs rise
considerably as the length of stay increases
Automobiles & pets (0.4%)
Banks (0.1%)
Basic Resources (18.2%)
Chemicals (1.6%)
Construction & Materials (1.4%)
Financial Services (10.2%)
Food & Beverage (2.2%)
Health care (7.3%)
Industrial Goods & Services (14.6%)
Insurance (0.4%)
Media (4.9%)
Oil & Gas (13.8%)
Personal & Household goods (3.6%)
Retail (2.2%)
Technology (12.9%)
Telecommunications (1.4%)
Travel & Leisure (3.5%)
Utilities (1.6%)
18.2
%


