


 43 / 92

43
A recent Freedom of Information request
by Suffolk Life gives us an insight into
just how many people have breached the
lifetime allowance over the last few years
- the data below shows the tax take from
the tax charge on assets held in pensions
above the lifetime allowance:
“VCTs provide valuable tax-free income at a time when tax-free income is scarce”
Will Fraser-Allen, Albion Ventures
The rise in the tax take may indicate that
as the lifetime allowance has declined,
more investors have been caught out
by it - this is the group that should have
been utilising other investment options
such as VCTs.
ANNUAL ALLOWANCE
At the same time, the annual allowance
has been reduced quite dramatically.
This might have the effect of making it
less likely that today’s younger savers
will reach the lifetime limit, but it does
mean that some wealthier investors
could well find that they need to look for
other tax-efficient investments as they
are fully utilising their pension and ISA
limits each year.
HIGHER EARNERS
Recent changes mean that anybody earning between £150,000 and £210,000 have
a reduced annual allowance and anybody earning greater than £210,000 have an
annual allowance of just £10,000.
So although pensions higher rate tax relief has survived for the moment at least, this
sliding scale of reduction in the annual allowance significantly reduces the opportunity
of pensions for higher earners and once again makes other tax-efficient options, such
as VCTs, more attractive.
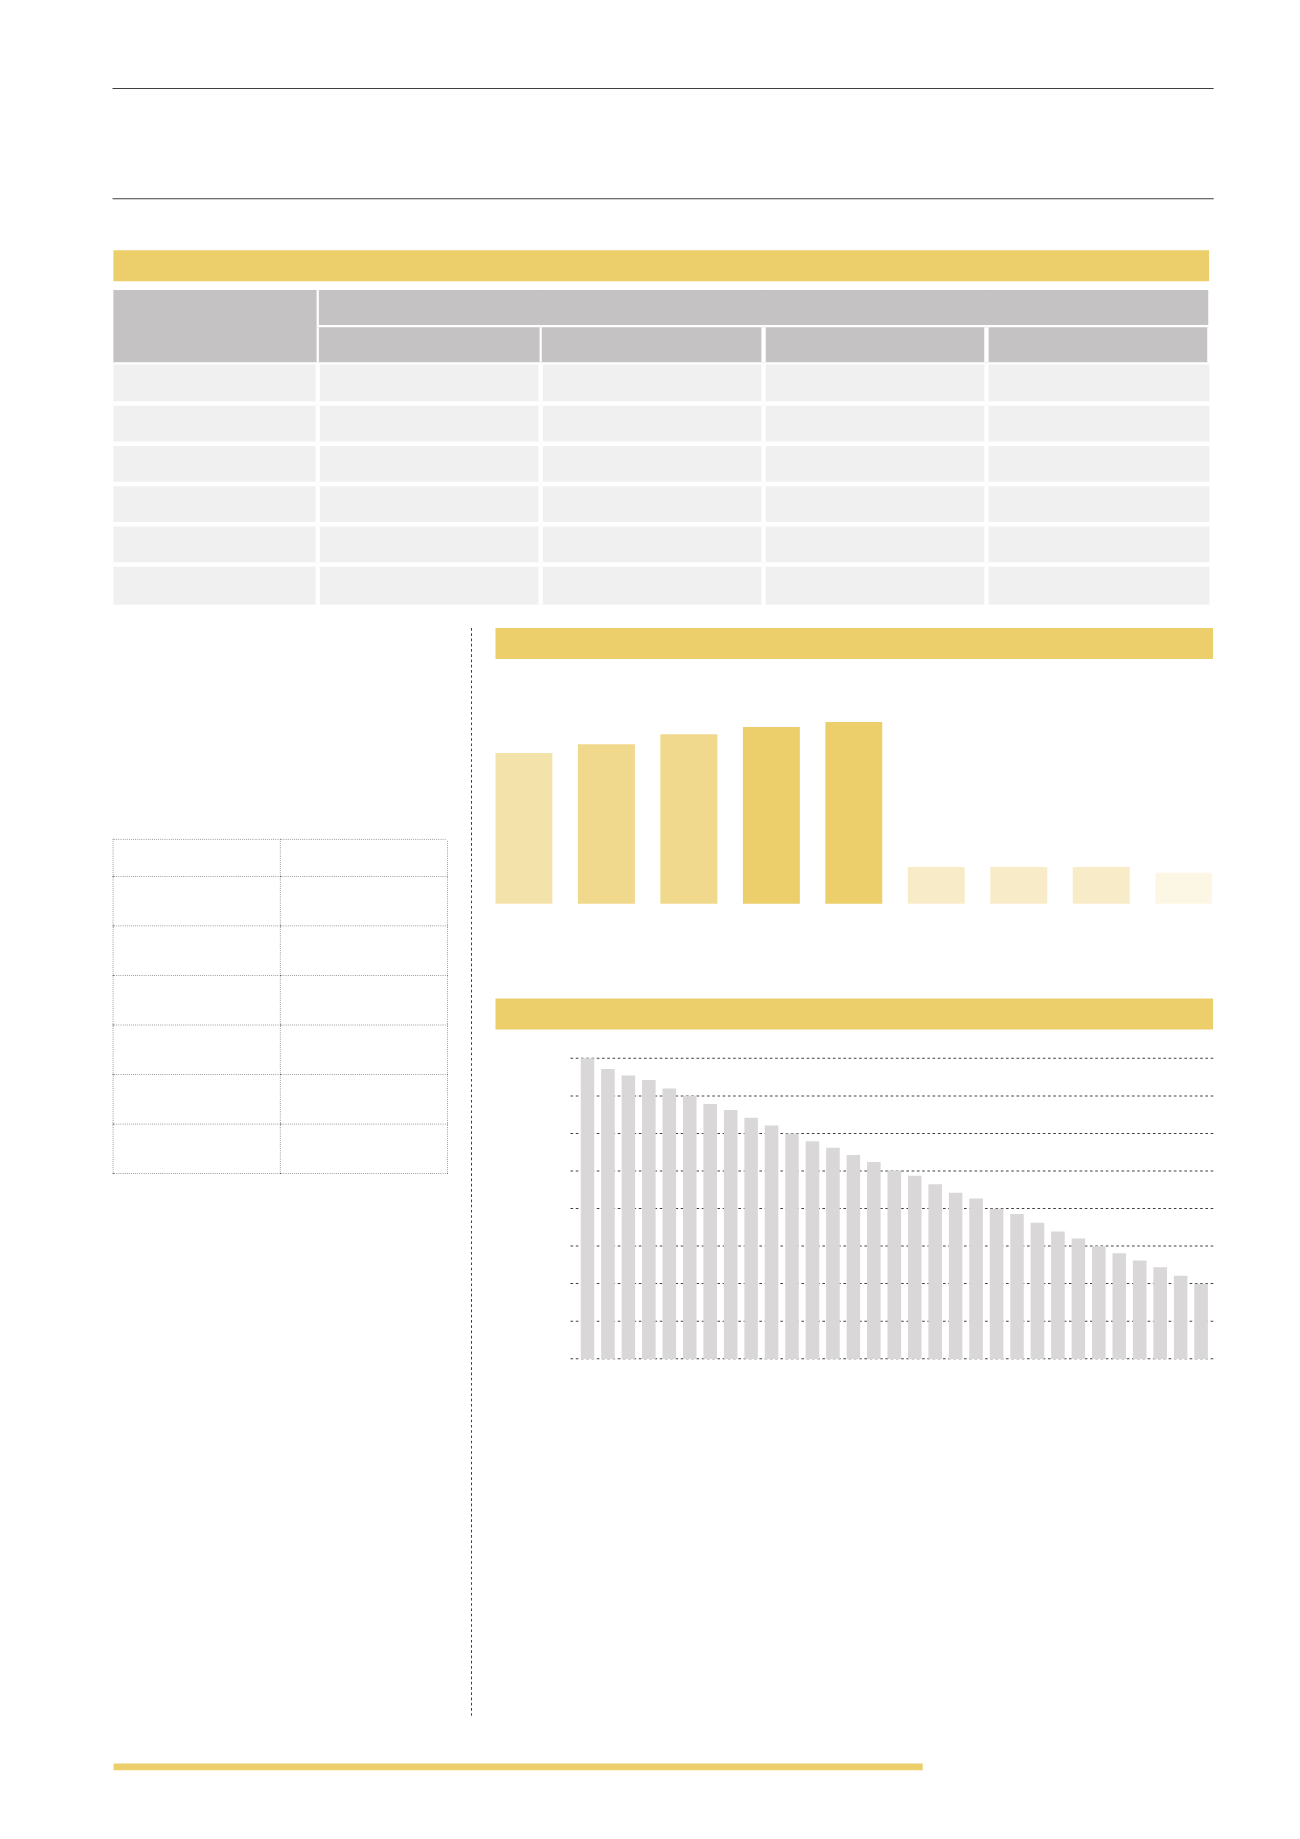
POSSIBILITY OF PENSION FUNDS REACHING THEIR LIFETIME ALLOWANCE
YEARS TO
RETIREMENT
FUND GROWS AT:
2%
4%
6%
8%
3
£ 1,177,902.92
£ 1,111,245.45
£ 1,049,524.10
£ 992,290.30
5
£ 1,132,163.51
£ 1,027,408.88
£ 934,072.72
£ 850,729.00
7
£ 1,088,200.22
£ 949,897.27
£ 831,321.39
£ 729,362.99
10
£ 1,025,435.37
£ 844,455.21
£ 697,993.47
£ 578,991.86
15
£ 928,768.41
£ 694,080.63
£ 521,581.33
£ 394,052.13
20
£ 841,214.17
£ 570,483.68
£ 389,755.91
£ 268,185.26
TAX YEAR
TOTAL
2009/10
£24,858,248
2010/11
£31,404,737
2011/12
£46,953,535
2012/13
£52,995,280
2013/14
£98,013,014
2014/15
£94,200,118
ANNUAL ALLOWANCE FOR PENSIONS
(2006-2015)
Source: HM Revenue and Customs
2006/07
£215k
£225k
£235k
£245k
£255k
£50k
£50k
£50k
£40k
2007/08 2008/09 2009/010 2010/11 2011/12 2012/13 2013/14 2014/15
ANNUAL ALLOWANCE - SLIDING SCALE FOR HIGHER EARNERS
Source: HM Revenue and Customs
£40,000
£35,000
£30,000
£25,000
£20,000
£15,000
£10,000
£5,000
£150,000
£166,000
£186,000
£202,000
£158,000
£174,000
£194,000
£210,000
£154,000
£170,000
£190,000
£206,000
£162,000
£182,000
£198,000
£178,000
£0
Source: Suffolk Life