


 20 / 92

20
HISTORY OF VCTs
VCTs were launched in 1995 and were
designed to encourage individuals to
invest indirectly in a range of small,
higher risk trading companies whose
shares and securities are not listed on a
mainstream stock exchange.
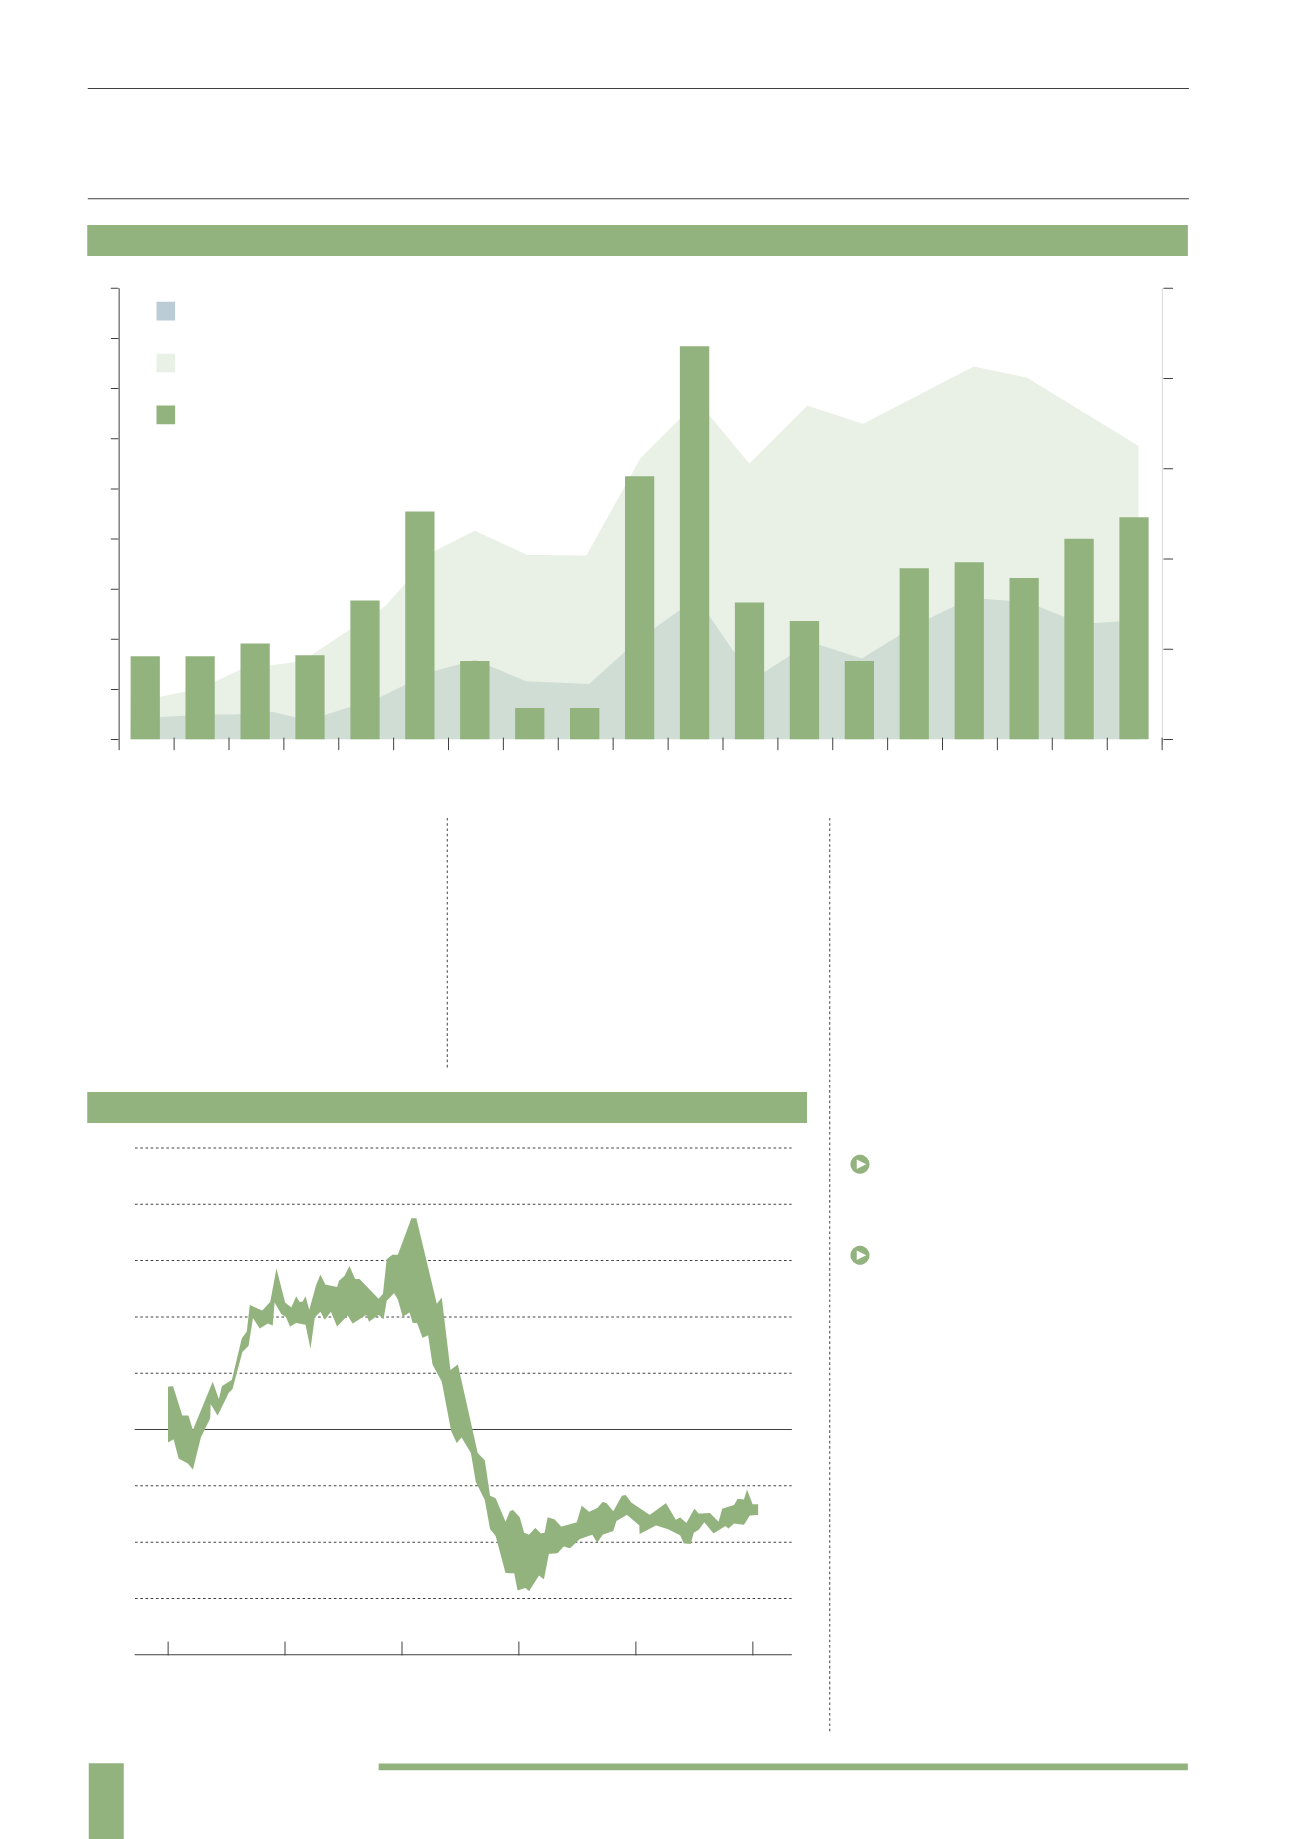
The market grew steadily for the first
five years of its life, but then fundraising
suffered badly in the collapse following
the dot com boom of 2000, where
smaller companies found themselves
out of fashion. The “boost” years of
2004-05 and 2005-06, where the
upfront tax relief was increased to 40%
gave fundraising a much needed lift.
Unsurprisingly, fundraising dropped
off again once this incentive was
normalised at 30% relief once more
in 2006-07, and the years 2007-09
were also comparatively lean thanks
to the financial crisis and subsequent
recession. The £440 million raised in
2013-14 was the fourth highest ever
total, and the second highest if the
boost years are discounted. The total
assets of the sector are estimated to
stand at over £3.5 billion (AIC).
A full list of the key policy changes that
have impacted on VCTs are included in
the appendix on page 88, but there were
some very positive changes in 2013:
The lifting of the gross assets test to
no more than £15 million, up from £7
million previously
The lifting of the maximum a VCT can
invest in an individual company to £5
million, up from £1 million
There were also big changes announced
in the 2015 summer Budget - which we
discuss on page 30.
Another positive development for VCTs
has been the banks’ retrenchment from
lending post 2008. Prior to the crash,
some banks would lend at 98% loan-
to-value with no covenants, securing
a lot of the best deals and leaving the
VCTs with lower levels of deal flow. Since
2008 VCTs have been able to move in
and pick up some of the slack and this
is reflected in the strong fundraising
figures - and again, emphasises the role
they play supporting growing SMEs.
900
1995 1996 1997 1998 1999 2000 2001 2002 2003 2004 2005 2006 2007 2008 2009 2010 2011 2012 2013 2014
250
200
150
100
50
0
800
700
600
500
400
300
200
100
0
VCT MARKET GROWTH
(1995-2015)
Source: HMRC (2015)
Number of VCTs raising funds
Number of VCTs managing funds
Funds raised
160 170 190
270
270
230
150
340 350
325
400
440
450
155
70 70
520
780
165
30
10
25
5
20
0
-10
15
-5
-15
LENDING TO UK BUSINESSES
(2004-2014)
2004
2006
2008
2010
2012
2014
Source: Bank of England (2015)
Percentage changes on a year earlier
Funds raised (£million)
Number of funds
VCT Fundraising has waxed and waned in response to market conditions and policy changes
Banks have withdrawn their supply of lending to UK small businesses since 2008