26
A. 71% of investments are distributed
through a network of agents (regulated and
unregulated) as well as directly to investors.
On average those that distribute through
agents use two distribution companies.
Nearly 30% of providers have increased the
amount of direct marketing over the last
year in order to increase sales. Another 30%
have increased the number of distributors
over the past 12 months through increased
marketing, whilst 14% have decreased their
marking over the past 12 months due to
regulatory changes and restrictions.
Q. Do you pay commission to agents/
advisers?
A. Every investment provider that
distributes their investment through
agents or intermediaries pays commission,
although no respondents stated the level
of commission paid.
Q. Any planned changes to distribution
over the next 12 months?
A. Looking forward over the next 12
months, 43% of respondents plan to
increase their distribution through
regulated agents whilst a further 14% plan
to increase distribution through non-
regulated agents.
PRODUCTPROVIDERSURVEYANALYSIS
0%
20%
40%
60%
80%
2013
68%
68%
32%
32%
2012
Retail
Institutional
0%
20%
40%
60%
80%
2013
26%
74%
2012
UK
Overseas
66%
34%
SALES
Q. What is your target raise? (£)
A. Providers are looking to raise between
£10m and £200m into their forestry
investments, with an average across the
sector of £82m.
Q. How much have you raised to date? (£)
A. Every respondent has raised money into
their investment. This ranges from only
£200k to nearly £200m, with £44k raised
on average across the sector.
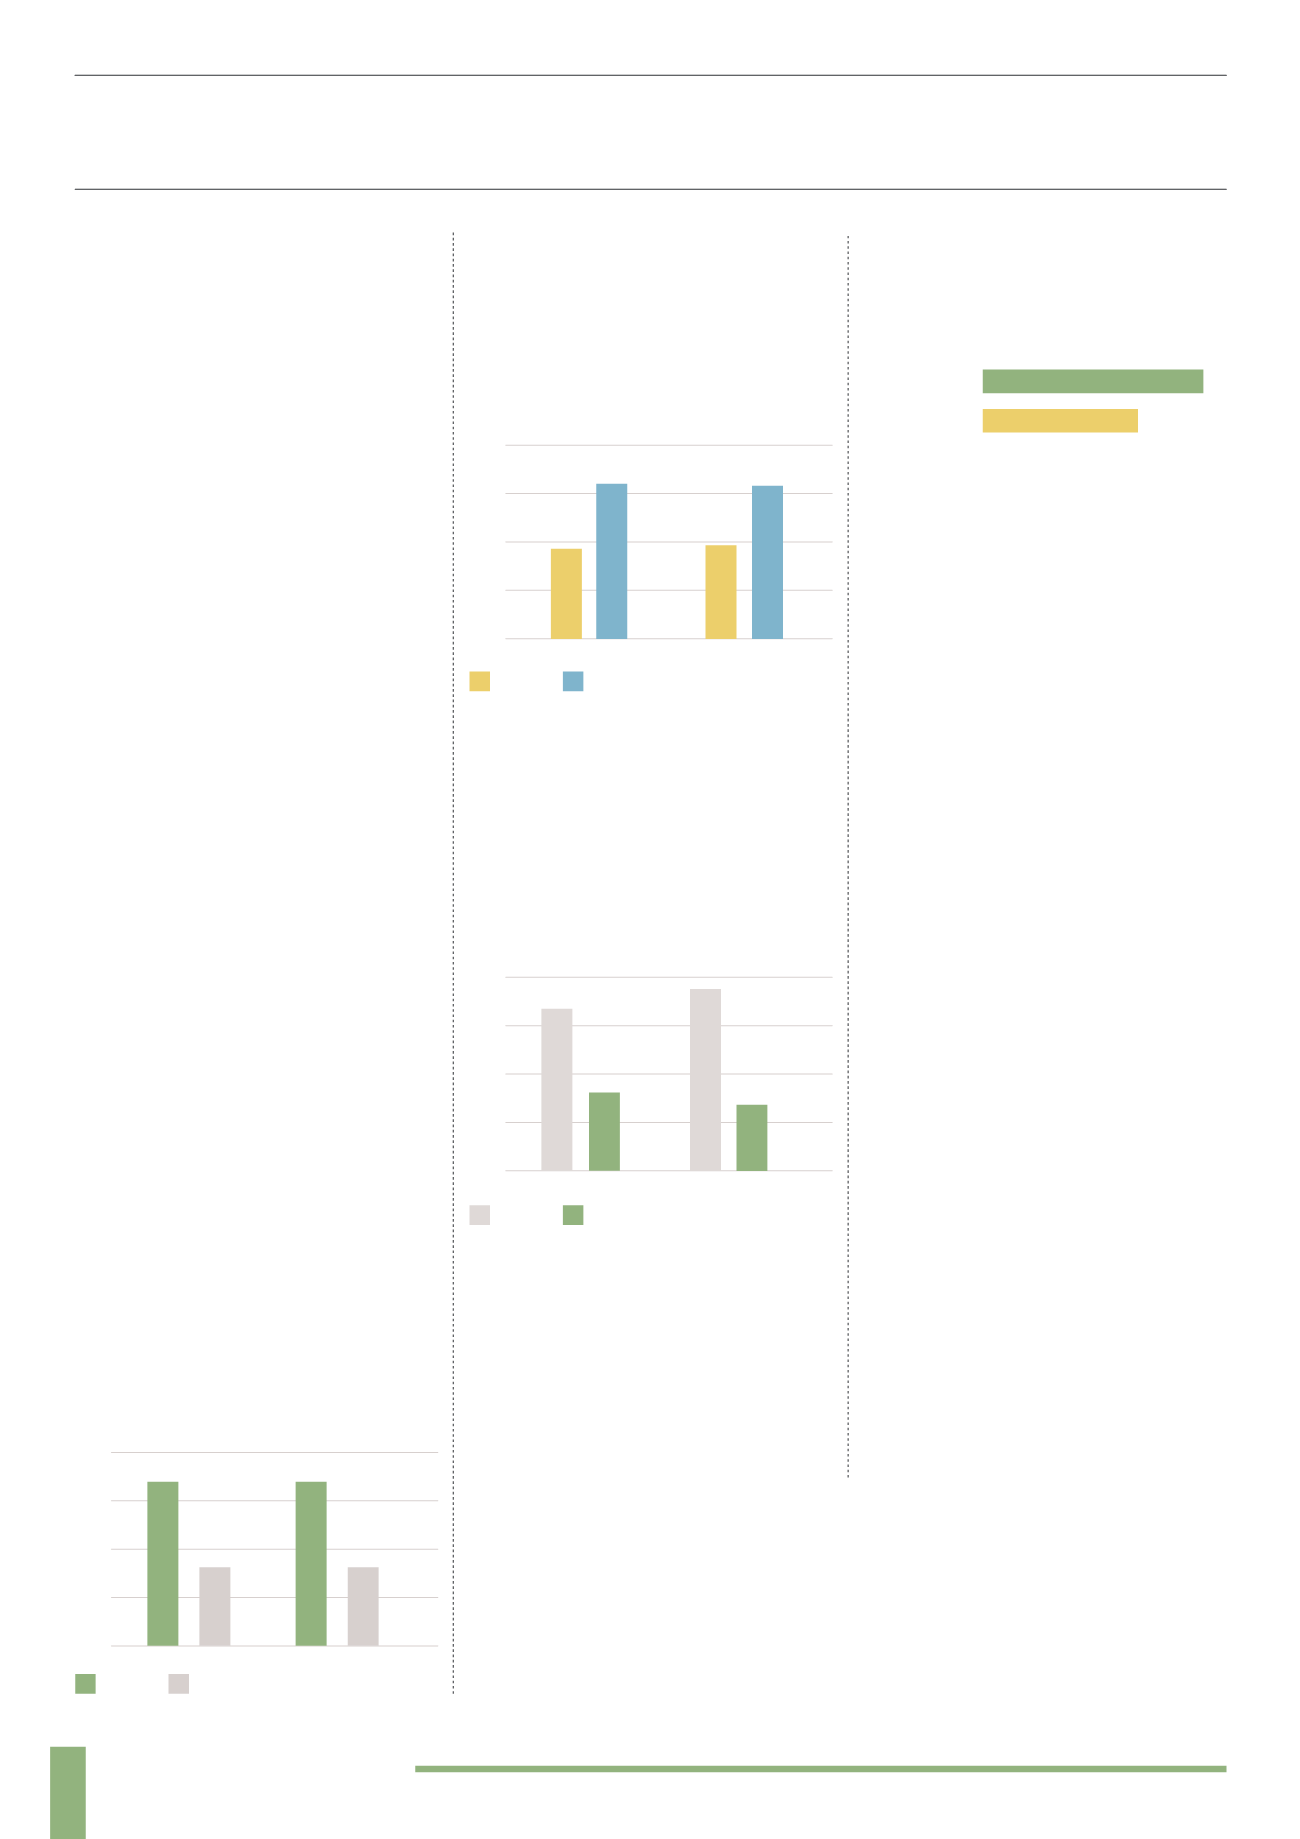
Q. Retail vs. Institutional Investment
0%
20%
40%
60%
80%
2013
62%
38%
2012
SIPP
Cash
37%
63%
A. Over 70% of respondents have
received investment from both retail and
institutional investors over the last couple
of years. On average, 68% of investment
has come from retail investors with
relatively little change over the last 2 years.
Q. SIPP vs. Cash Investment
A. There was a decrease in SIPP investment
from 2012 to 2013, although based on
these figures the reduction was not as
severe as expected after interventions
from the regulator in 2013. The proportion
of investment via cash increased from 62%
in 2012 to 63% in 2013.
Q. UK vs. Overseas Investment
A. There was also a significant decrease
in investment from UK based investors
from 2012 to 2013 which could have
been impacted by the increased focus on
alternative investments from the FCA.
This is also likely to have been impacted
by the increased popularity of alternative
investments from emerging economies in
South America and South-East Asia.
OTHER PRODUCTS
Q. Do you have any other investment
products in the pipeline?
Available now
60%
40%
In the Pipeline
A. When asked about other investment
products, 40% of respondents currently
have another investment open and 60%
have a further investment in the pipeline.
Product providers may be looking to
take advantage of increased demand
for forestry investments from emerging
economies and expand their offerings in
the future.
CONCLUSIONS
Some of the key conclusions drawn from
this analysis include:
▲
▲
Over 85% of forestry investments are
structured as direct asset purchases
▲
▲
Nearly 60% of investments claim to be
allowed within a personal pension
▲
▲
Minimum investments start from as
low as £5,000
▲
▲
Measures to protect investors are
relatively weak
▲
▲
29% of investments charge an initial fee
(on top of the initial investment)
▲
▲
57% have charges on an ongoing basis
and 71% charge fees on exit
▲
▲
Every investment offers variable
returns which are predicted to range from
6-15% per year
▲
▲
57% of investments are sold to ordinary
retail investors
▲
▲
The vast majority (71%) of investment
providers pay commission to agents and
intermediaries in return for distribution


