


 58 / 92

58
VCT PERFORMANCE
AND HURDLE FEES
Normally this section would show the
typical performance fees and hurdle
rates that are seen in the VCT market,
with some charts to show you at a glance
what to expect. However, our normal
data collection exercise of digging
through annual reports, third party
reviews and investment prospectuses,
found that although performance fees
are described as “in line with normal VCT
practice”, it seems that there actually is
no normal VCT practice for calculating
the performance hurdles.
However, we should also note that not all
VCT providers charge a performance fee.
Our analysis is based upon those that
do, but readers should be clear that it is
possible to find VCTs that only charge the
initial and ongoing fees, without taking a
share of the investors’ returns.
Performance fees are meant to align the
interest of managers and investors and
to motivate managers to generate higher
returns by meeting a particular hurdle
rate and taking a percentage of that
return above the hurdle rate. Some have
criticised the industry for not targeting
performance that is worth rewarding.
Now the performance fees aren’t the
difficult part to calculate – the industry
ranges from 10% to 30% of returns
made above the hurdle rate, with the
most common hurdle rate set at a
return of 20%.
It was examining the hurdle rate where
we encountered some problems. There
is not an industry standard and very few
are easily comparable. Some depend
on a certain distribution per share each
year, some on a certain distribution
amount and increase in NAV, some just
an increase in NAV, total returns that
beat inflation plus a certain percent, the
list goes on. The most common way in
which VCT managers calculate a hurdle is
through distributions to investors, but as
we say, don’t just trust that this is what
you’re signing up for: check the IM and
speak to the manager.
There seems to be a trend for Evergreen
funds to use dividends or total
distributions as a hurdle rate, which makes
it simpler. Limited Life VCTs set their hurdle
rates based on the total distribution to
investors when they close the fund.
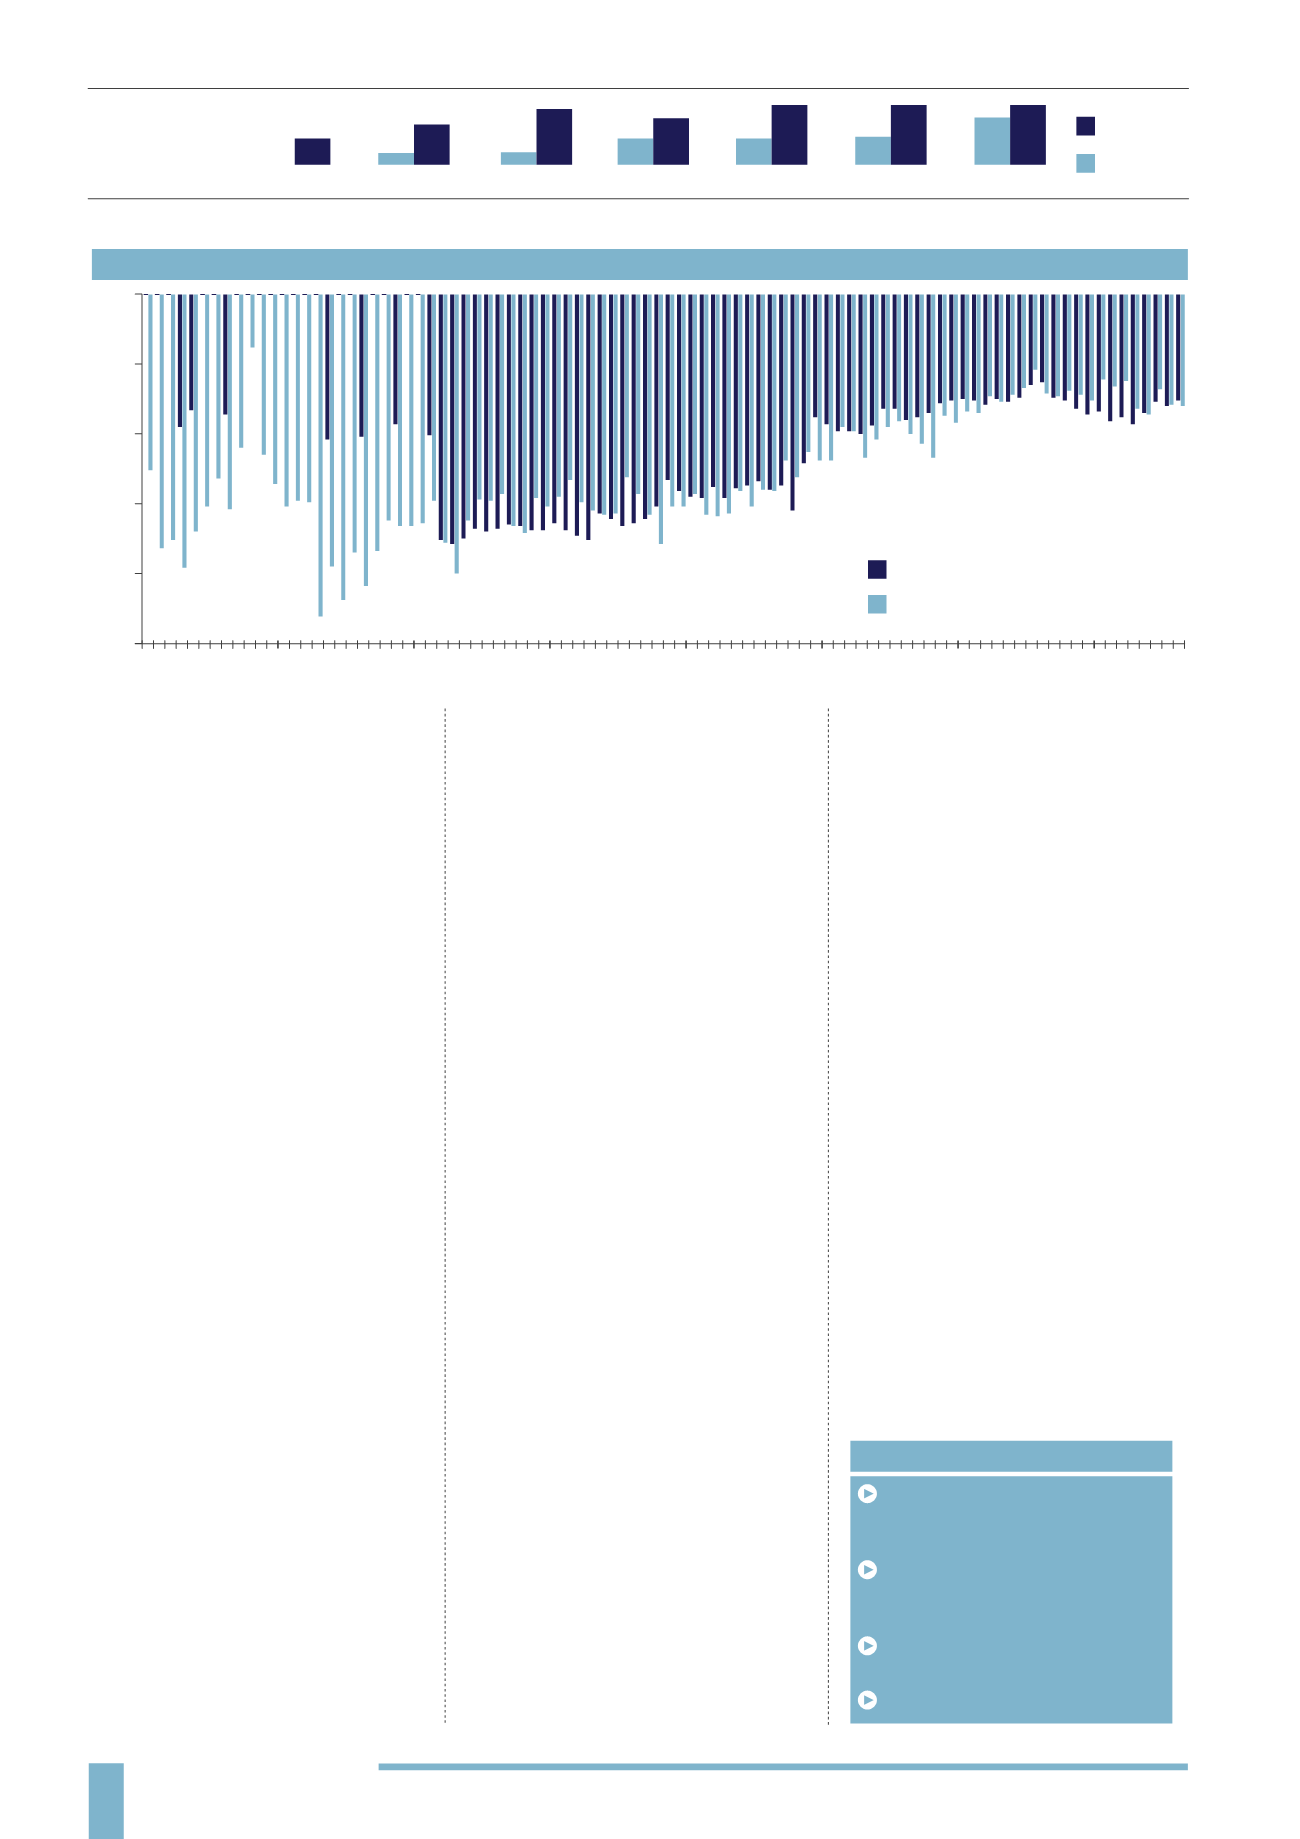
VCT DISCOUNTS
We examined the average discount over
time for the Generalist and AIM Quoted
sectors. Looking at the Generalist sector
discount, although we have some areas
of missing data, we can see the discounts
have ranged from 7.9% to 6.3% since
2008. For AIM VCTs the discount has
ranged from 3.8% to 23.1% in April 2009.
According to the AIC, the average
investment company discount at the
time of writing was near record low
levels of 5.2%, even after the volatility in
the market during the summer of 2015.
According to the AIC, currently 60% of
investment companies in the industry
have discount control policies. The
investment companies that do not have
themmainly invest in illiquid assets, like
KEY POINTS
Discounts have been as much as
-23.1% in the AIM Quoted sector, and
-17.6% in the Generalist sector
75% of VCTs are either focused on
growth, income or a combination of
both
Specialist VCTs have a much higher
concentration of assets
Average min. investment is £5,000
property and private equity, which would
be difficult to liquidate at a particular time.
The most widely used discount control
policy for VCTs are redemption offers,
although there are other types such as
tender offers and continuation votes.
Remember that the NAV can rise or
fall depending upon the frequency
of valuations and the timing of
any realisations or acquisitions of
underlying assets.
CONCLUSIONS
The market analysis shows us how the
VCT industry has developed over time,
introducing more products such as
AIM Quoted, Limited Life and Specialist
VCTs. We can see that there are
differences in the level of diversification
that these products tend to have, and
it is interesting to see how the discount
changes over time. Charges are higher
than more conventional investments,
which we think is reasonable given the
nature of their investment universe, but
it is difficult to assess and compare the
potential impact of performance fees.
VCT
CHARGES
(% OF INITIAL
INVESTMENT):
VCT DISCOUNTS
0
-5
-10
-15
-20
-25
2009
2010
2011
2012
2013
2014
2015
VCT Generalist sector
VCT AIM Quoted sector
MIN
2
MEDIAN
2
4.5
MODE
5.5
2
UQ
2
MAX
3.5
5.5
LQ
3
1.9
AVERAGE
1.92
4.23
Initial charge
Annual AMC
5.5