


 53 / 92

53
OVERALL ANALYSIS
In this section we help readers get their arms around the whole of the VCT market by compiling and examining some of the available data
on VCTs, both historically and for today’s open offers. Much of the data has come from MICAP Ltd, the online platform and comparison
engine for tax-efficient alternative investments. Intelligent Partnership is a part of the same group of companies as MICAP.
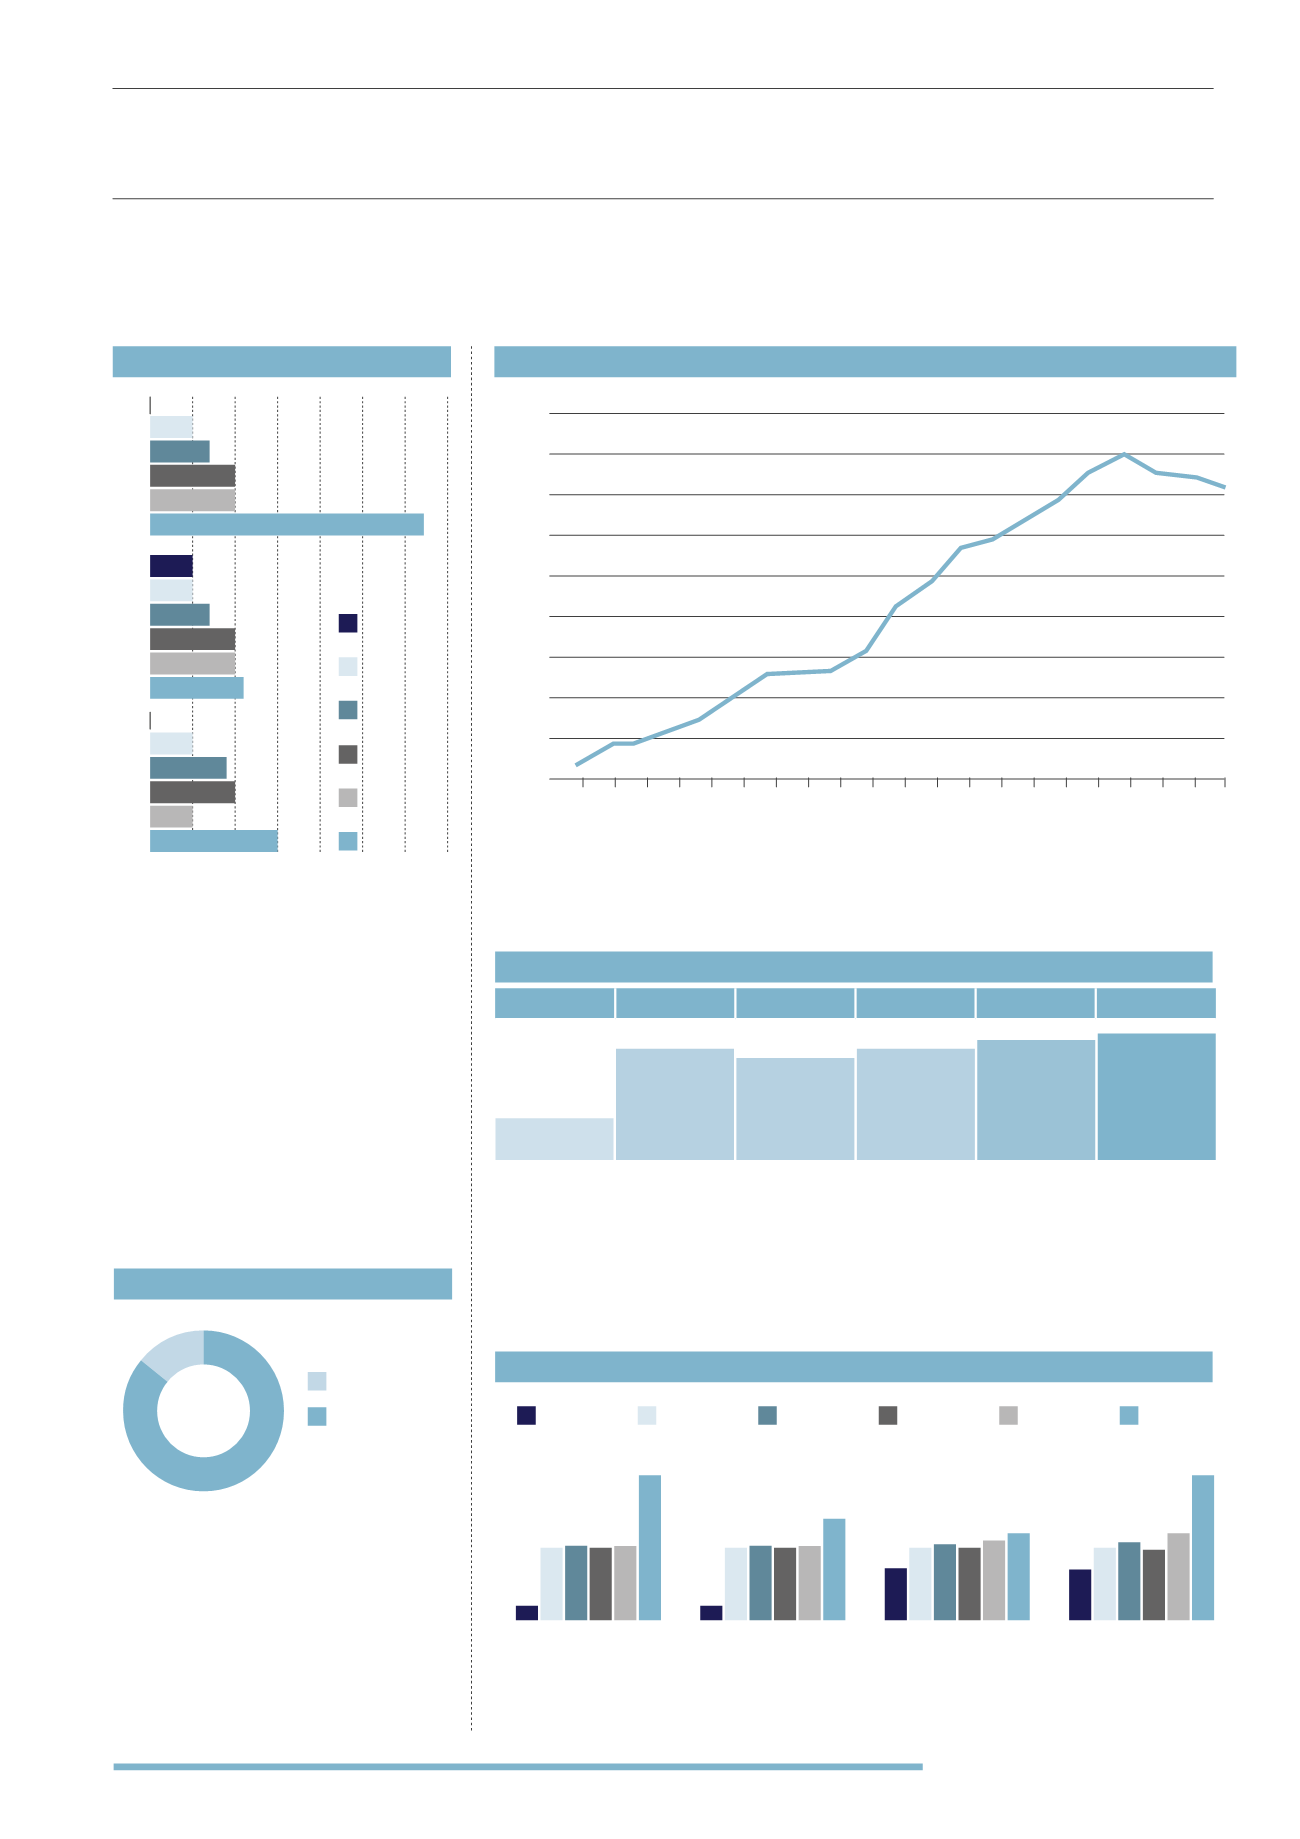
The VCT market development shows consistent growth in the market until 2012. Since 2012 there
has been some consolidation in the market, with several mergers in 2013. The consolidation of the
market is a positive result from the rule changes seen in the VCT sector; limits on VCTs lifted allowed
for companies to merge and become more cost effective and competitive.
At the time of writing the difference between
the NAV and share price range from a 150%
premium to a 70% discount. Many VCT
shareholders will not want to rely on selling
their shares on the secondary market for an
exit and instead, providers offer investors
the opportunity to sell back their shares after
a certain time frame at a given discount or
discount range. Some will buy back shares at a
nil discount to NAV, but the most common policy
in the market is to buy back at a 10% discount.
As we noted earlier, these policies are subject
to the VCT having the funds available to buy-
back shares.
Minimum investment levels are consistent across the whole market. The most common entry level
is £5,000, but the highest minimum investment level is only £6,000. In cases where investment
managers are offering shares in several VCTs or VCT share classes, they may allow investors to
split their investment across several VCTs, lowering the minimum investment per VCT and allowing
greater diversification benefits. The minimum investments are higher than mainstream stock market
based OEICS, but lower than more risky EIS and other venture capital and private equity funds.
Tax-free dividends are possibly the most attractive feature of VCTs and many funds state what
levels of dividends they will be targeting for their investors. The yields are attractive compared to
many other assets (although of course the additional risks and costs must be taken into account).
OVERALL VCT MARKET GROWTH
(1995-2015)
SHARE BUYBACK POLICIES
MINIMUM INVESTMENT
(2015)
TARGET DIVIDEND RETURNS
(PENCE PER SHARE)
(2015)
A substantial majority of VCTs are closed for
new investment at around 86%. Only a small
portion (14%) of the overall VCT market is open
for new investment. However, Evergreen VCTs
open and close periodically for top-up offers or
by way of new share class. This allows advisers
and investors to choose from a range of
established products and invest at the time tax
benefits are needed.
OVERALL VCT STATUS
Open
Closed
86%
14%
15
22 26
36
47 48 49
59
80
92
109
114
123
133
147 147 145
141
155
3
12
180
160
140
120
Number of operating VCTs
100
80
60
40
20
10
95
98
02
96
99
03
95
00
04
08
06
10
13
97
01
05
09
12
07
11
14
Overall
1
1
3.6
3.5
5
5
5
5
5.15
5.15
5.25
5.38
5
5
5
5
5.13
5.13
5.5
6
10
7
6
10
Generalist
AIM
Specialist
Min
LQ
Average
Mode
UQ
Max
15
MIN
LQ AVERAGE MODE
UQ
MAX
GENERALIST
SPECIALIST
AIM
Min
LQ
Average
Mode
UQ
Max
10% 5% 0%
15% 20% 25% 30% 35%
10%
5%
5%
5%
5%
5%
7%
7%
10%
10%
9%
10%
11%
15%
10%
32.2%
£6,000
£5,750
£5,000
£5,000
£2,000
£4,920