16
Academic research includes Ex Post: The
Investment Performance of Collectible
Stamps, Professor Elroy Dimson of the
London Business School and Christophe
Spaenjers, PhD student at Tilburg University,
they include a price index from 1899 to 2008.
This index has been produced from their
database of catalogue prices (in GBP) of
British stamps. This includes data from
each edition of the Stanley Gibbons’ price
catalogue from 1899 (edition 13) to 2008
(edition 111). Note that this data does not
include “special varieties” (the rarest and
most desirable stamps), whereas Stanley
Gibbons’ indices consist of more than half of
these class of stamps. The index has been
rebased to 100 beginning in 1899. Over the
109 year period that the index covers the
average compound growth was 6.98%.
This index has tracked annual compound
growth of 6.98% over 109 years, 7.03% over
20 years and 12.73% over 10 years. When
we compare this to the performance of the
three Stanley Gibbons’ indices analysed
earlier: the GB30 saw annual compound
growth of 8.37% over 20 years; the GB250
achieved 11.4% over 10 years and the China
200 saw growth of 10.7% per year over 25
years. There are some clear trends that
jump out, including that longer-term 20 year
performance is closely representative of
the performance over the last century, and
in the shorter-term the best performance
has been seen over the last 10 years.
However it should be noted that there was a
long period of flat to negative returns during
most of the 1980s and well into the 1990s.
This period can perhaps be explained as a
reaction to a bubble that formed in the 1970s
in response to a collapse in conventional
asset prices –showing the performance of
stamps as a diversifier. Coins experienced
a similar rise in prices in the 1970s.
FURTHER INFORMATION
For insight into detailed stamp performance,
Stanley Gibbons’ data is at:
.
stanleygibbons.com/news-and-research
GB
200
COIN INDEX
Stanley Gibbons launched the GB200 Coin
Index in May 2012 to provide transparency
for investors (and collectors) to the British
coin investment sector. The index charts
the performance of 200 rare British coins
with prices based on independent coin
catalogues published by respected experts.
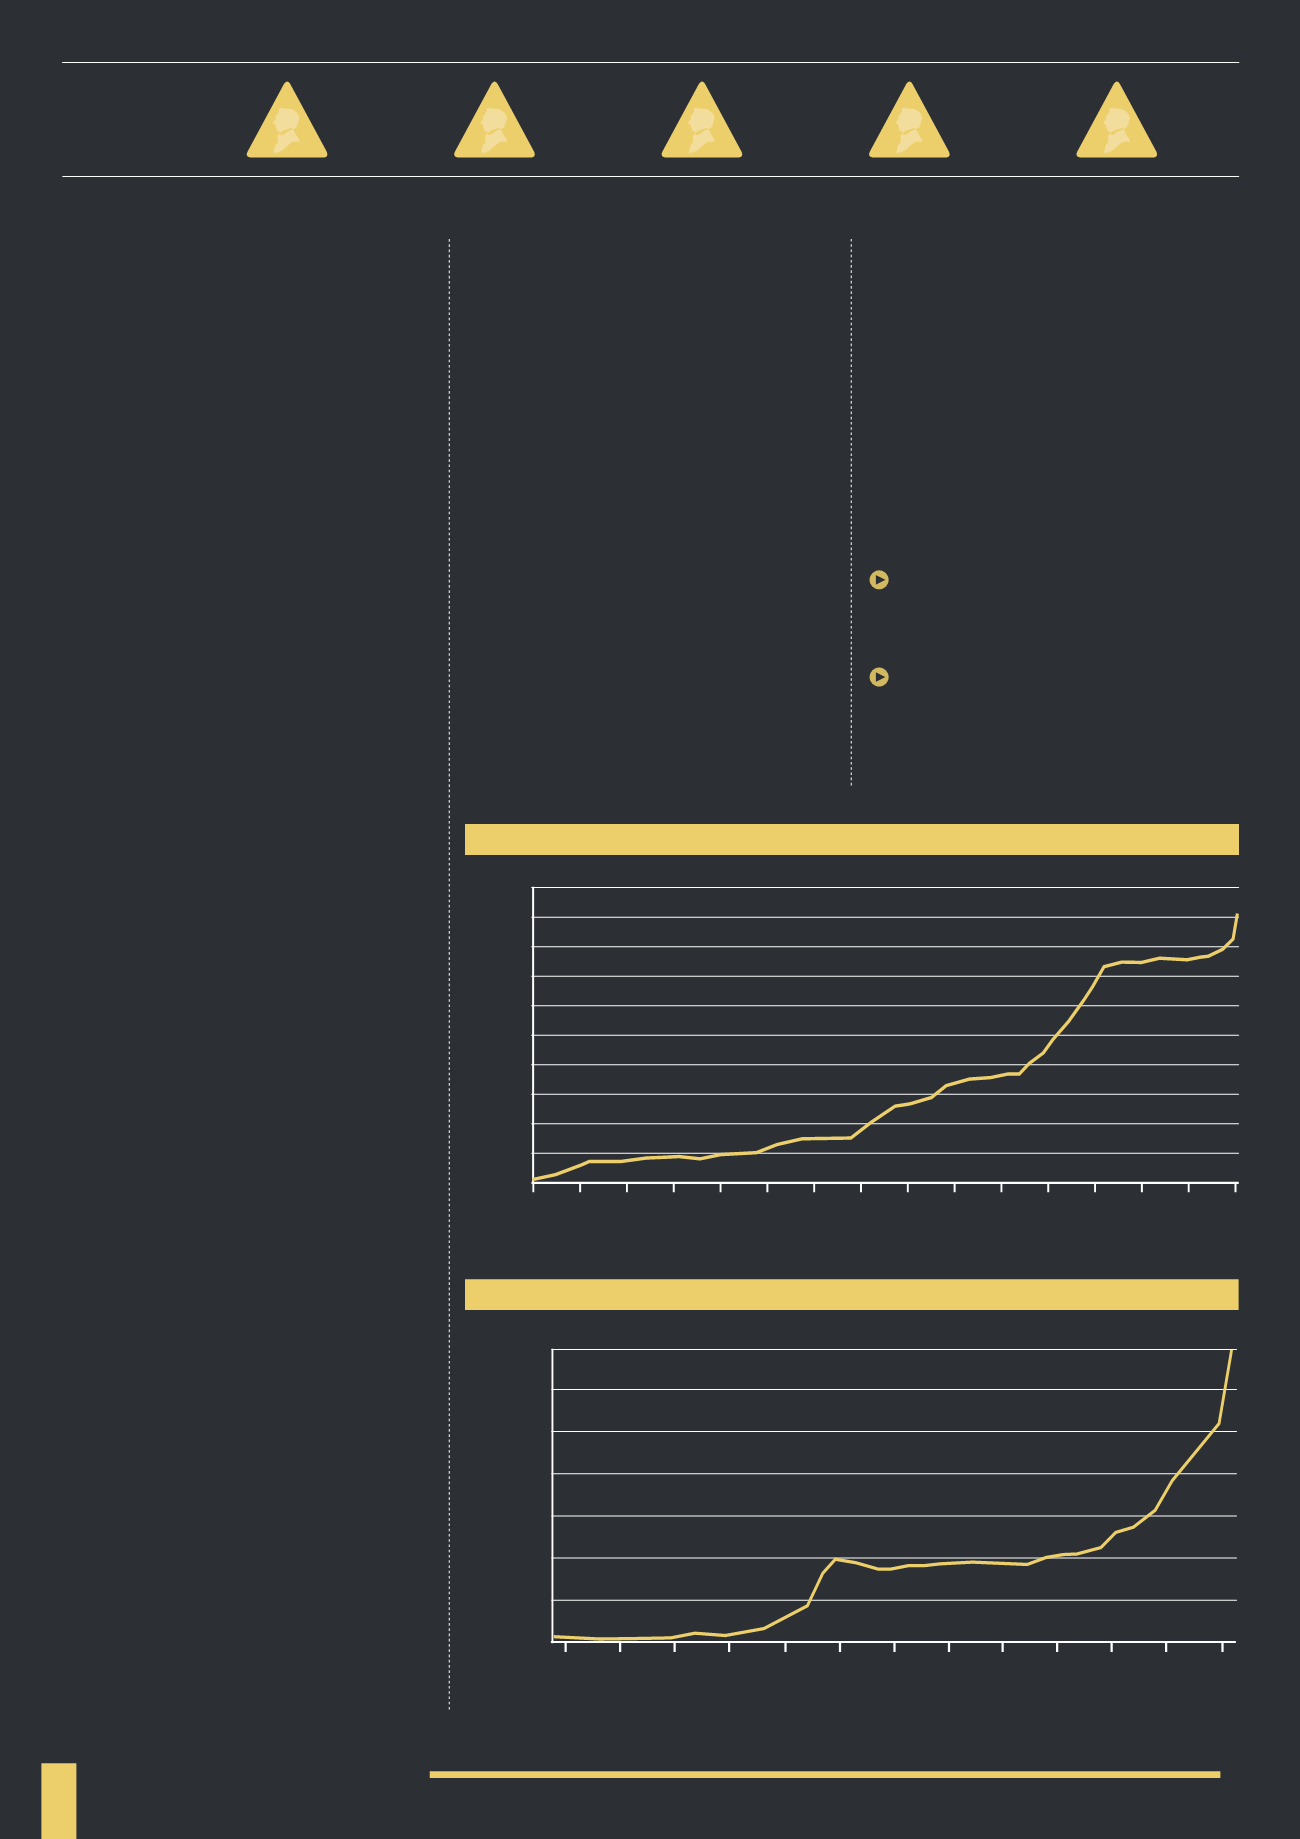
Source: Ex post: The Investment Performance of Collectible Stamps
DIMSON & SPAENJERS INDEX
1960-2008
160,000
140,000
120,000
100,000
80,000
60,000
40,000
20,000
1960
1964
1968
1972
1976
1980
1984
1988
1992
1996
2000
2004
2008
DIMSON & SPAENJERS INDEX
1899-1960
1100
1000
900
800
700
600
500
400
300
200
100
1899
1903
1907
1911
1915
1919
1923
1927
1931
1935
1939
1943
1947
1951
1955
1959
As with other Stanley Gibbons’ indices
this is quoted on the Bloomberg
Professional® service (STGIRCIX).
Of course there are some limitations with
this index: data has been backdated; the
weighting of the index and performance is
influenced more heavily by expensive coins;
and there is a lack of other data streams and
indices to compare performance against.
Coins included on the index range from
early 1st Century Celtic coinage to mid-
20th Century coins from the reign of
George V – they range in value from
£1,250 to £55,000 at 2002 prices, £5,000
to £275,000 at today’s prices (2014).
GB200 Coin Index saw compound annual
growth of 12.75% over 10 years, higher than
the 11.4% from the GB250 and 9.06% GB30
rare stamp indices over the same period.
Performance has been stronger over the last
5 years, with compound annual growth of
13.91% - rare stamps saw lower performance
over 5 years than the longer 10 year period.
CONCLUSIONS
What is noticeable is that although there
are periods where stamps and coins
underperform other markets, over the
long-term they have out-performed, but
without the volatility and downturns
that characterise other markets.
The strongest performance
across all indices has been seen over
the last 10 years (2004–2014)
Although growth has continued to be
positive, it has slowed since the financial
crisis – possibly due to investors cutting back
on luxury investments such as rare stamps
STAMP
GROWTH
RATES (%):
AVERAGE
100 YEAR
10 YEAR
20 YEAR
50 YEAR
12.73
7.66
7.08
10.84
7.05


