15
The compound annual growth of the GB30
Rarities Index over the past 5 years was
4.51%, compared to 9.06% over 10 years
and 8.37% over 20 years. The 1873 2½d.
rosy mauve (Unused) achieved annualised
compound growth of 10.76% over the last
5 years, double the growth of the index.
GB
250
INDEX
The Stanley Gibbons GB250 tracks the
performance of the top 250 traded
investment grade British stamps over
the last 12 years. It is accessible via
the Bloomberg Professional® service
(STGIGB25) and is frequently quoted
in the financial press as it provides a
broad view of the investment market
for British stamps. This is the largest
stamp index in existence and used
by many in the industry to track and
evidence the performance and returns
on rare stamp investing. This index
includes watermark varieties, specimens,
errors and Government Officials.
Again there are limitations to this index:
Higher priced stamps have a higher
weighting in the index (which takes an
average based on price) and therefore
more impact on the overall performance
of the index (for the positive or negative).
A number of stamps included in
this index are far too expensive for the
vast majority of investors to purchase
(if looking to create a diversified stamp
portfolio containing a number of stamps)
It is not realistic for an investor to
purchase/own all 250 stamps – unlike
the FTSE for example, when an investor
can invest in an ETF which covers the
whole index. Therefore investors cannot
diversify across the index as a whole
STANLEY GIBBONS CHINA 200
MARKET STUDY
The Stanley Gibbons China market study
tracked the prices and performance
of 200 rare investment grade Chinese
stamps. This data is not on the Bloomberg
Professional Service® but stamps have
been selected by experts to provide
a cross section of the Chinese stamp
investment market as a whole.
This data tracks the prices of Chinese
stamps from 1989 to present (2014).
Stamps range in value from £70 to £12,000
at 1989 prices - £1,200 to £325,000
today. The total value of the 200 stamps
included in this study has increased from
£356,165 in 1989 to £4,522,300 today,
an increase of over £4.1m – compound
annual growth of 10.7% over 25 years.
The China 200 index returned 280.65%
over the previous 8 years (2006-2014).
The performance of stamps on this
index has been far more volatile than the
GB30 or GB250. Returns from individual
stamps range from a loss of 37.5% to total
returns of 2,809.09% over the period.
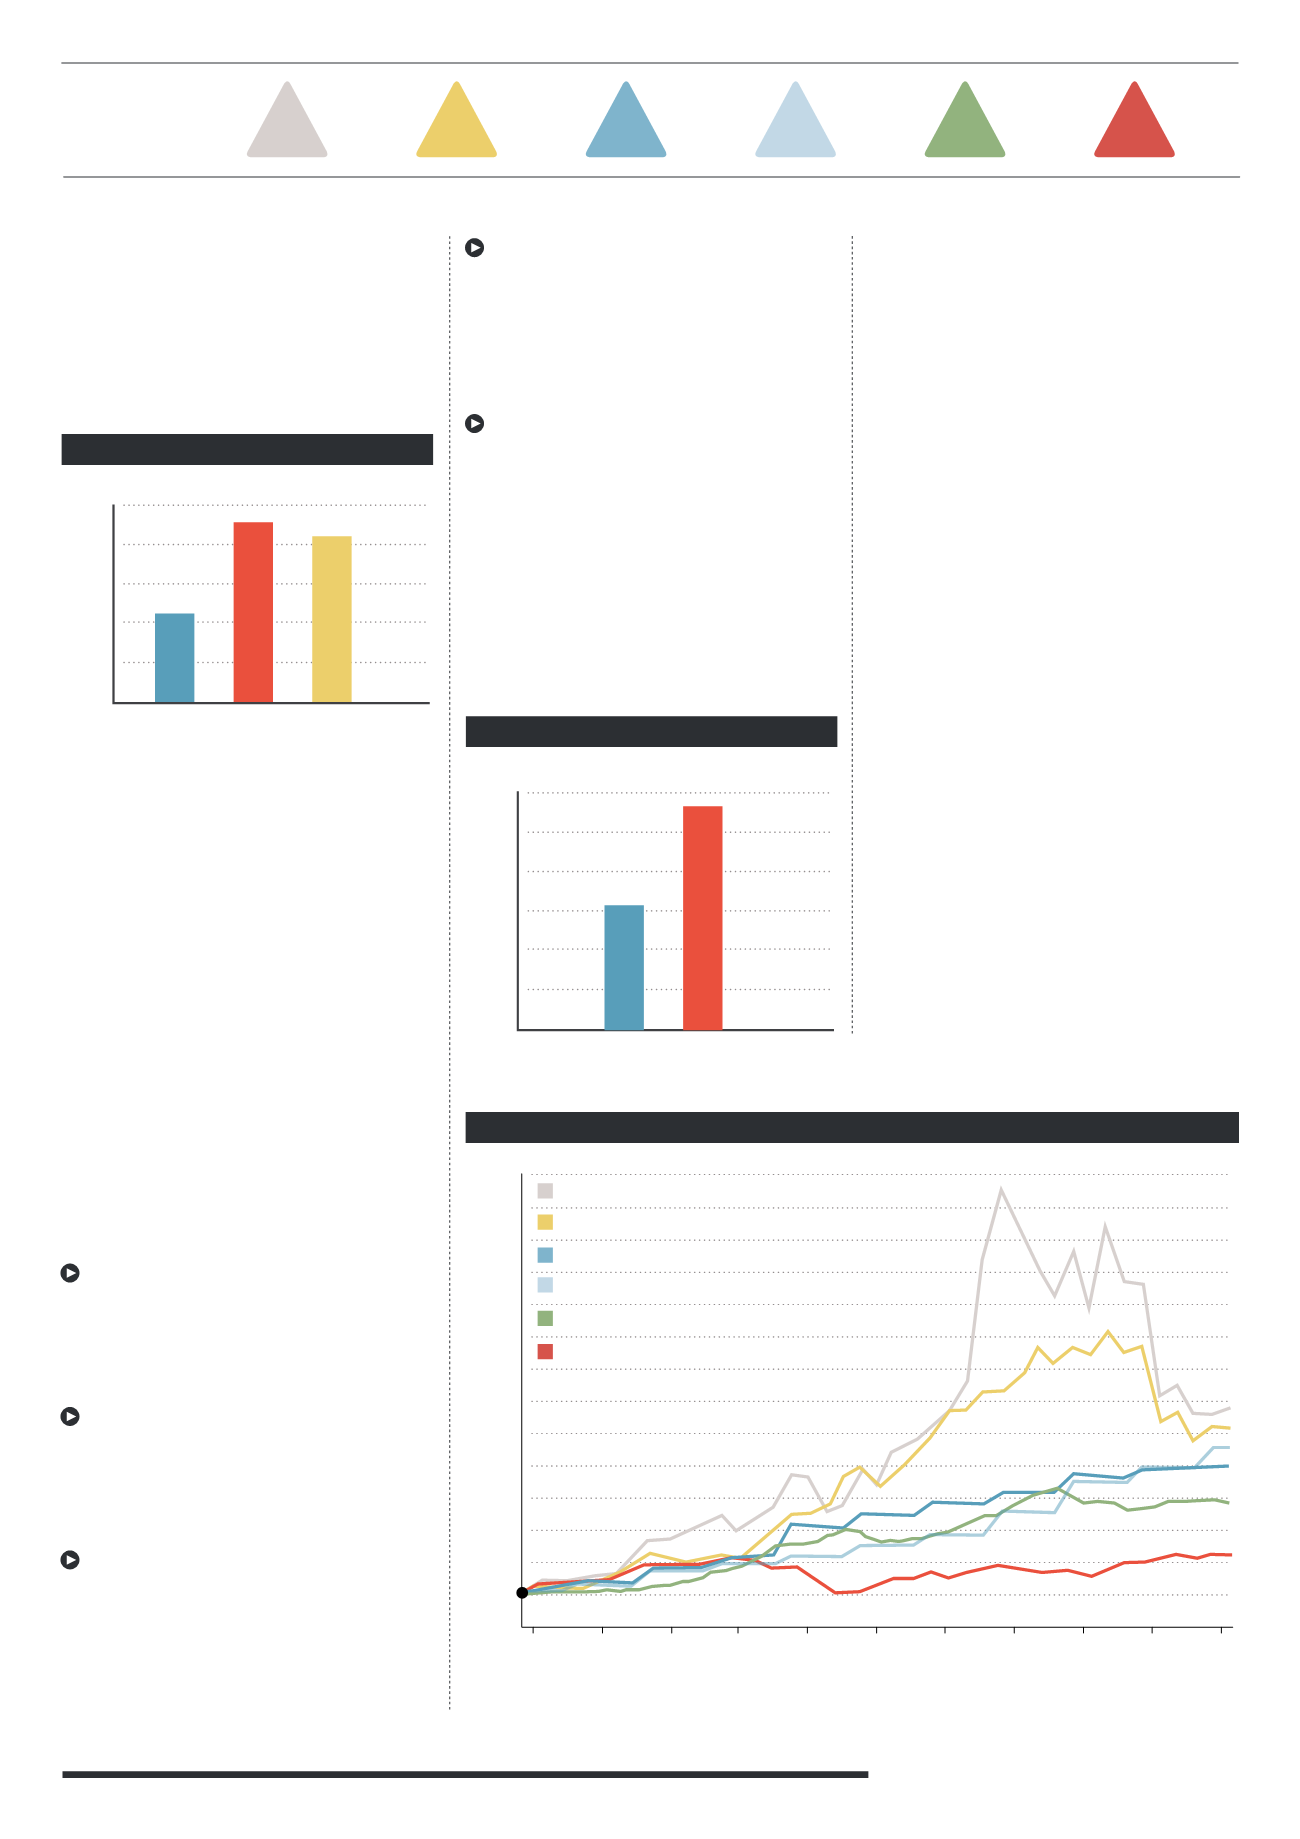
COLLECTIBLE INVESTMENT INDICES
750
700
650
600
550
500
450
400
350
300
250
200
150
100
50
2004 2005 2006 2007 2008 2009 2010 2011 2012 2013 2014
Source: World Gold Council, London Silver Fixing, FTSE, Stanley Gibbons, Liv-Ex
There is a wide variance in the
performance of individual stamps – how
does an investor know which to purchase?
This is where knowledge, research and
analysis are important, but analysing
past performance has many limitations
The index (as with the GB30
and China 200) is limited to Stanley
Gibbons’ catalogue prices
The GB250 index has seen a total return of
195.02% over the last 10 years – compound
annual growth of 11.4%. Compound
annual growth over the last 5 years
has been only 6.04% - stamps have not
performed as strongly since the financial
crisis and throughout the recession.
Silver
Gold
GB200 Coin Index
GB250 Stamp Index
Liv-Ex
FTSE 100
GB30 ANNUAL GROWTH*
0%
Last
5yrs
Last
10yrs
Last
20yrs
2%
4%
6%
8%
10%
GB250 ANNUAL GROWTH*
0%
Last
5yrs
Last
10yrs
2%
4%
6%
8%
10%
12%
2004 - 2014
10 YEAR
ANNUAL
GROWTH (%):
*Compound annual growth
SILVER
12.75
11.43
NOT
AVAILABLE
4.31
13.42
14.32
GOLD
COINS
STAMPS
WINE
FTSE 100


