6
INTERNATIONALDEMAND
The UK has five of the world’s top 20
universities (2012 QS World University
rankings) and is in an extremely strong
position to attract international students
and take advantage of increased global
student mobility.
Students are now extremely mobile
and willing to study abroad in order to
increase their chances of success in the
challenging and competitive global business
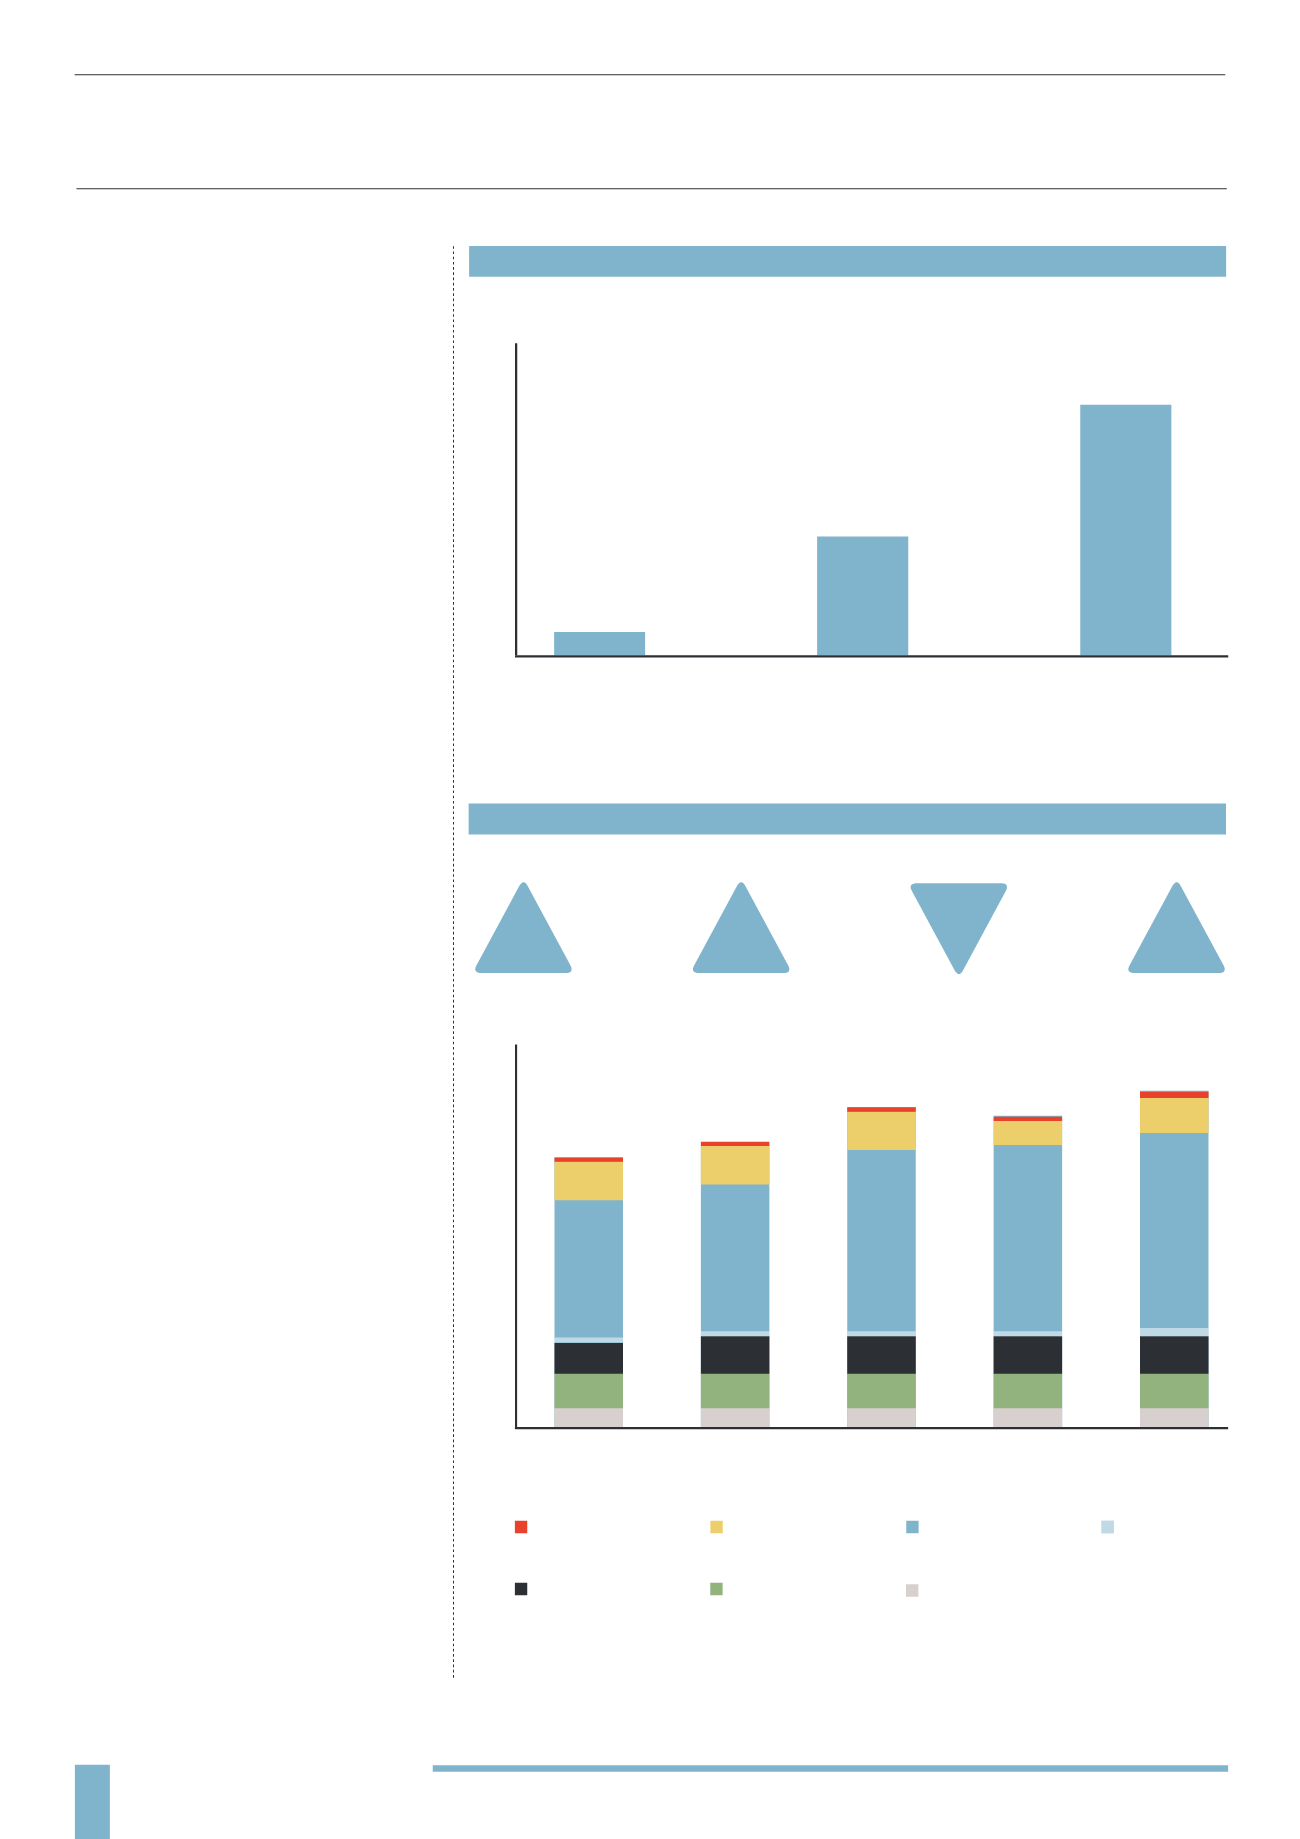
environment. Projections predict a growth
in the number of students studying outside
of their country of residence from 3.7m in
2010 to 8m in 2025 (in 1975 this figure was
only 600,000) according to Savills student
research. The UK should benefit as there is
no cap on the number of overseas students
(Non-EU) that can be accepted by UK
universities.
Between 1997 and 2011 the proportion
of international students studying at UK
universities increased from 6.3% to 11.9%
and global demand has risen each year since
the 2007 financial crisis. There was 13% year
on year growth in non-EU students studying
in the UK from 2009 to 2010 and 7% from
2011 to 2012, although 2010 to 2011 saw a
slight fall in numbers of nearly 3% according
to UCAS figures. Overall, there was a 27%
rise in non-EU student numbers from 2008
to 2012.
International (non-UK) students account for
17% of the UK student population. London
is the most popular destination with 35%
international students, followed by the East
of England (24%) and the West Midlands (18%).
The number of international students in
London rose by 9% year on year from
2009 to 2010 according to the Higher
Education Statistics Agency (HESA), helped
by London’s reputation as a leading global
city. Other major cities with high numbers of
international students include Manchester,
Birmingham, Nottingham and Edinburgh.
The University of Manchester has the
highest number of international students
out of any UK university at over 11,000
students (HESA).
10
5
0
1975
2010
2025
(forecast)
0.6
3.7
8.0
GLOBAL STUDENT MOBILITY
Source: OECD
(Number of students - millions)
RISE IN NON-EU INTERNATIONAL STUDENTS
(2008 - 2012)
80K
60K
40K
20K
0
2008
2009
Source: UCAS
2010
2011
2012
2008-2009
8%
2010-2011
3%
2011-2012
7%
Other
Middle East
Far East
Australasia
Americas
Africa
Europe (ex. EU)
2009-2010
13%


