7
SECTORUPDATE
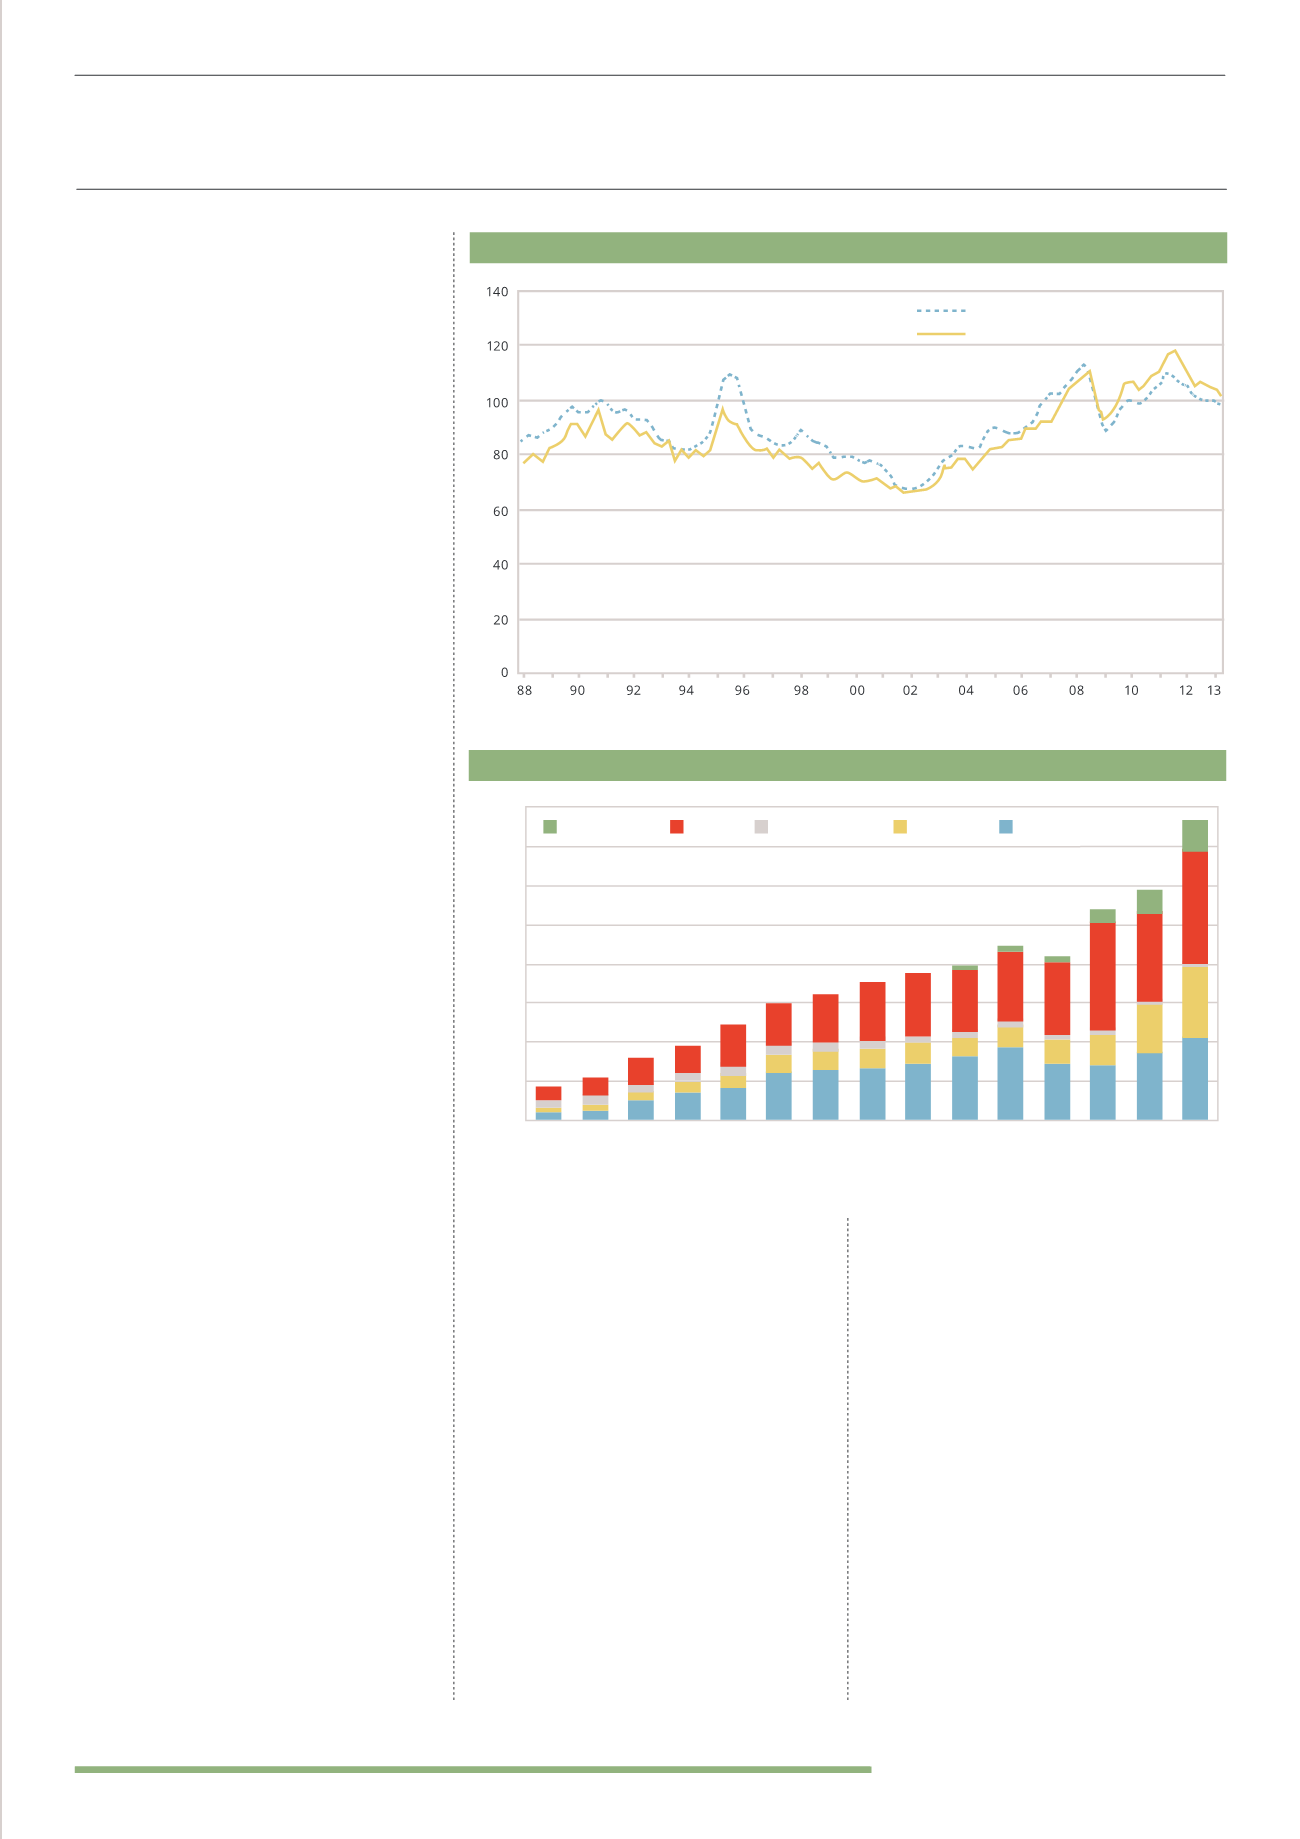
GLOBAL WOOD FIBER PRICE INDEX
(1998 - 2013)
Source: Wood Resource Quarterly
Softwood
Hardwood
BACKGROUND TO THE
GLOBAL FORESTRY SECTOR
The global forestry industry is valued
at US$327b according to the latest FAO
figures, an increase of 10% from 2000 and
334% from 1980.
Despite being considered uncorrelated to
traditional investments, production levels
were slow to recover from the financial
crisis, with year-on-year growth of 1-4%
between 2010 and 2011.
In the last two years however, the global
timber trade has increased by an estimated
25%. 2013 has been a record year in
the value of the UK market for instance,
with trade between October 2012 and
September 2013 totalling £97.3m (8.5 times
the value traded in 2000). Conservative
forecasts by the FAO estimate that the
global forestry sector will be worth
US$450b by 2020.
Global timber prices have risen significantly
from post-recession lows in 2009, reaching
an all-time high in Q2 2011. Since then
the Softwood Fibre Price Index (SFPI) has
fallen gradually and now sits 8.8% lower
than the 2011 peak. Consumption in the
developed world reduced substantially
during the 2008 recession, but as the wider
economy improves and activity within the
construction sector increases, demand for
timber in developed markets is forecast to
recover strongly.
Continued population growth and
urbanisation in the BRIC countries and
other developing markets is set to increase
timber prices to record highs. This upward
pressure on prices driven by consumption
will coincide with increasing constraints on
supply (such as the strengthening of the
global drive to eliminate illegal logging and
increase sustainable timber sourcing).
The Chinese government predicts their
total demand for timber will reach 350m
cubic metres (m
3
) by 2015, resulting in a
supply shortage of 150m m
3
(42%).
Indian demand for timber has been
predicted to grow from 58mm
3
in 2005 to
153mm
3
in 2020, whilst at the same time
wood supply is projected to increase from
29mm
3
in 2000 to only 60mm
3
. This will
create a supply gap of 93mm
3
(60% of total
demand) by 2020.
Total log consumption in the US is
projected to increase by about 22%
from 555m m
3
in 2002 to 677m m
3
in
2030. Imports are projected to increase
substantially to nearly 198m m
3
(40%).
The European Union is expected to
require 420m m
3
of wood biomass per
year for energy by 2020, a production
deficit of 200-260m m
3
(50%).
Over the last century the value of
timberland as an investment has risen
faster, and with less volatility, than the
broader equity and debt markets. Since
1987, the NCREIF Timberland Index has
risen by an average of 14.9% pa, compared
to about 11% for the S&P 500. Forestry has
seen positive long-term correlation with
inflation. It is also the only asset class in
existence to have gone up in three out of
the four major economic market collapses
of the 20
th
century.
In 2008, the av erage total return on
investment in forestry was 7%, down
from the previous high of around 20%
seen in 2006, but still outperforming both
equities and commercial property which
saw total returns of -29.9% and -22.1% pa
respectively.
US$/odmt
CHINESE TIMBER DEMAND
(1997 - 2011)
Source: Technorati.com
97 98 99 00 01 02 03 04 05 06 07 08 09 10 11
140
160
120
100
80
60
40
20
0
Pulp
Wood Panels
Lumber
Logs
Woodchips
Million Cubic Meters (m
3
)


