HMRC has released the latest statistics on the Enterprise Investment Scheme (EIS) and the Seed Enterprise Investment Scheme (SEIS). The release includes since inception data for both schemes on the number of companies that raised finance through the schemes and the amount of funds raised. The raw data is prepared for two groups of companies. The first group consists of companies that raised investment through EIS or SEIS for the first time and the second contains aggregate values for the whole market.
Based on this dataset, we produced a more in-depth analysis on EIS. We examine the dynamic relationship between first time companies and pre-existing companies as well as the relationship between the number of companies and the total amount of investment.
New funds vs additional funds
Figure 1 compares the proportion of companies raising money through EIS for the first time to companies raise additional funds through EIS.
The graph shows that to date the EIS market has been largely dominated by companies raising funds for the first time, contributing to more than half of the market in all years except 2008, 2012 and 2013.
However, the proportion of first time raising companies has declined significantly since 2000 dropping from around 80% to just above 50%. The proportion had recovered from 49% to 58% in the post financial crisis era (2008-2011) before dropping to its lowest level of 48% in 2012. However, new companies have been coming into the scheme since 2012. In particular, we can see the number has increased by 8% in the year 2014-15. The overall trend of an increase in the proportion of companies raising additional funds is very clear though.
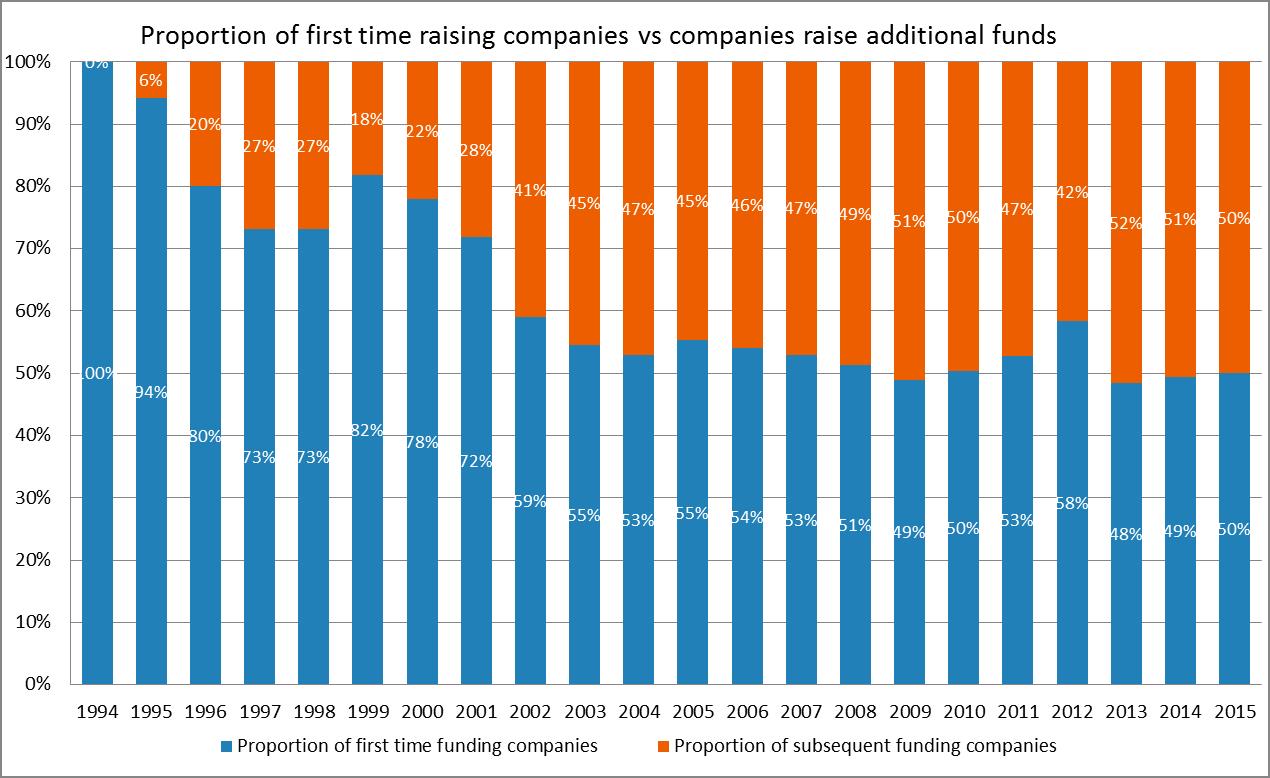
Figure 1
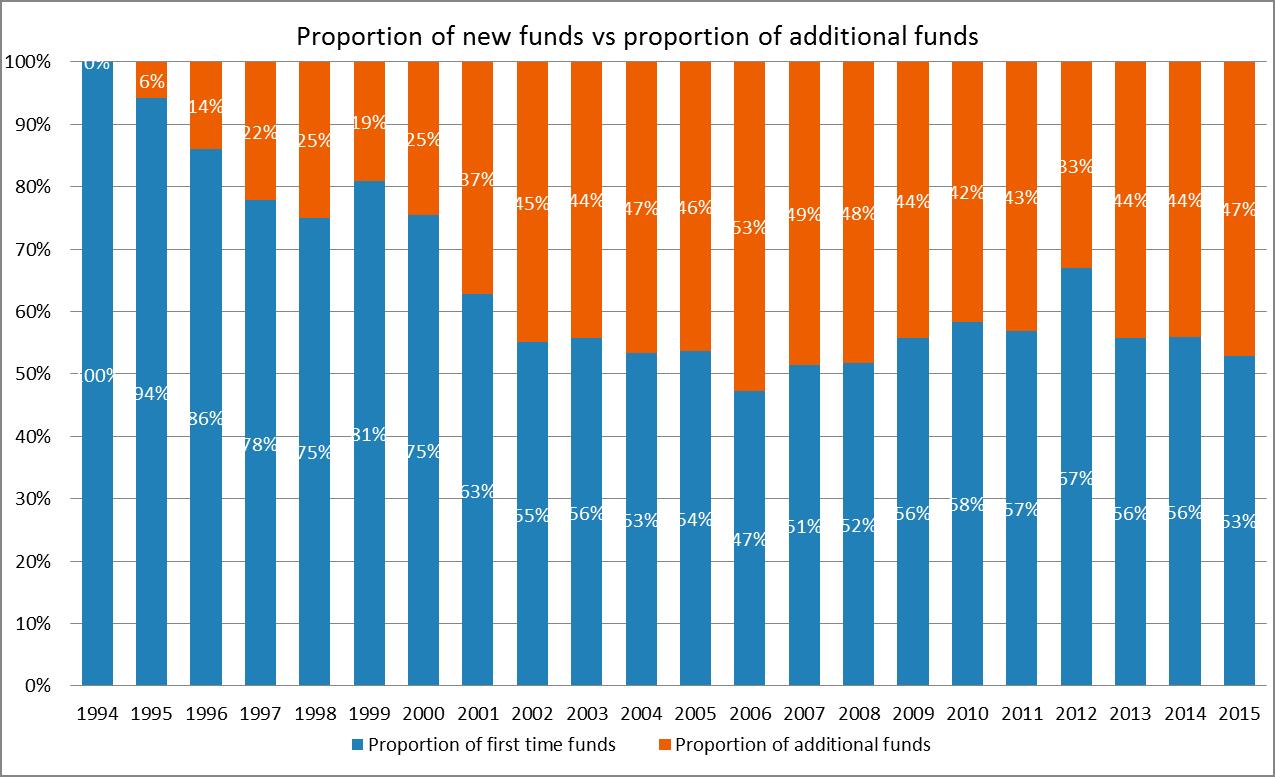
Figure 2
Similar to Figure 1, Figure 2 compares the proportion of funds raised by new companies to the proportion of subsequent funds raised. The distinction is the different underlying unit employed. In figure 1 the percentages are calculated by comparing the number of companies, whereas a monetary unit (£) is used to construct Figure 2.
Both figures show a similar pattern meaning the total amount of funds raised by first time companies or pre-existing companies in a given year is proportional to the total number of companies in that year. Nevertheless, in some years there is an inverse relationship. For example, in 2006, the proportion of pre-existing companies is 46%, while the total amount of money raised by those companies is 53% – meaning there were fewer pre-existing companies than first time companies, but that year they raised more money than first time companies. The opposite effect can be found in year 2012, in which less money was raised by a larger number of subsequent raises.
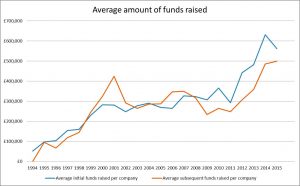
Figure 3
The above findings can be verified by examining the average amount of funds raised per company. As shown in Figure 3, the average amount of funds raised by the two groups of companies diverged in 2000. It seems that after the dot-com crash it became much harder to raise initial funds than it was to secure follow-on investment, which seems logical. However, we see the opposite effect post 2008: it appears to be easier to raise initial funding. We wonder if this is linked to the boom in renewable energy projects, which were seen as a safe bet in the volatile period after the financial crisis. Certainly the gap is narrowing again now, in the same period when changes to legislation have disbarred subsidised renewable energy from the EIS and focused investment on growth companies.
Year-on-year change
Over the whole period, on average a pre-existing company raises £150,000 more than a first time company.
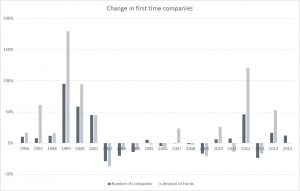
Figure 4
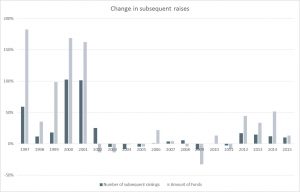
Figure 5
Figure 4 shows the year-on-year percentage change in the number of first time companies and in the amount of money raised by them. In most years, the two percentages have the same sign: meaning more companies also raised more money. However, in 2005, 2007, 2011 and 2015 however the two signs are different. For instance, the number of first time companies in 2007 was 1150, slightly less than the 2006 figure (1155) but the total amount of fund raised was 23% higher. Despite a greater number of companies coming into EIS for the first time in 2015, the amount raised by them has declined after an increase of 53% from 2013 to 2014. Does this reflect a focus on growth at the expense of capital preservation? If so, that would indicate that the changes to legislation are having the intended effect.
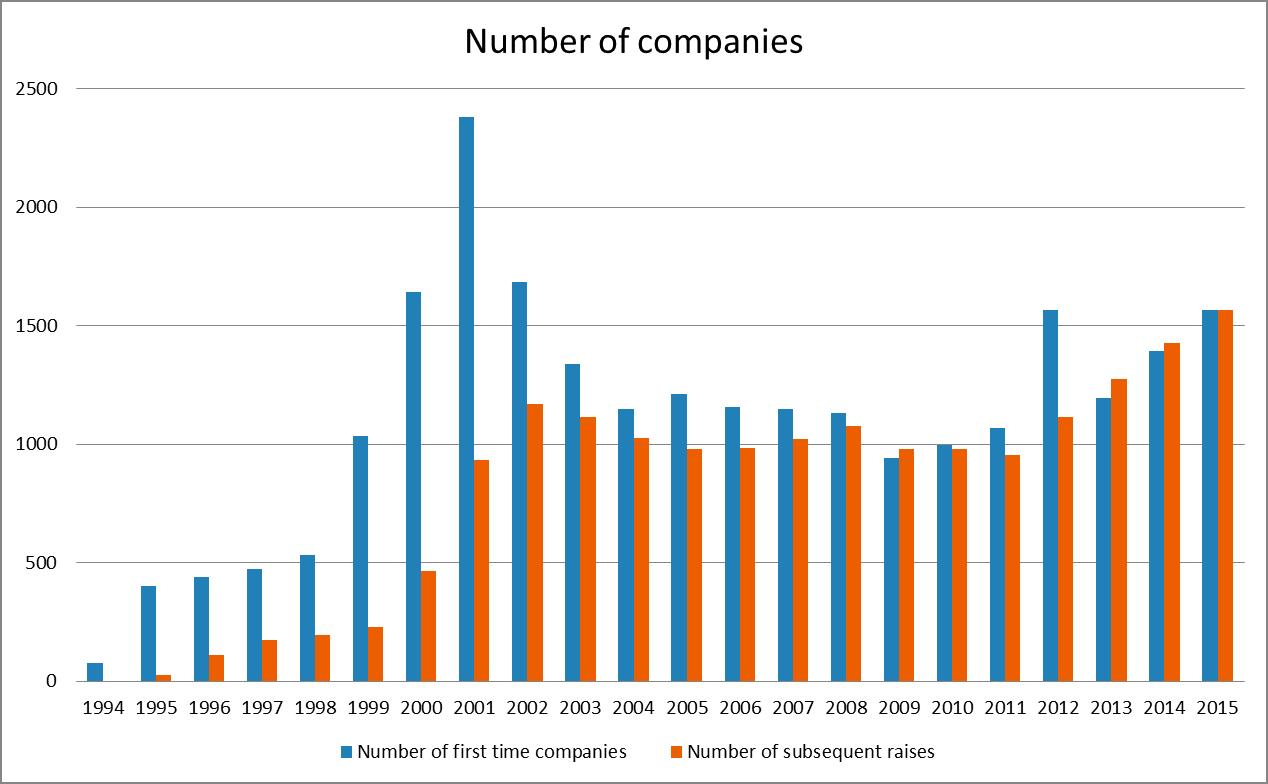
The EIS market expanded dramatically from inception until 2000, but was flat for the next 8 years. In 2009 the EIS market has experienced a whole market slowdown. The number of companies reduced by 17% and 9% in two respective groups and 21% and 33% in terms of funds raised. The EIS market has slowed again in 2015, perhaps a reflection of the ban on investing in renewables and other changes in legislation.
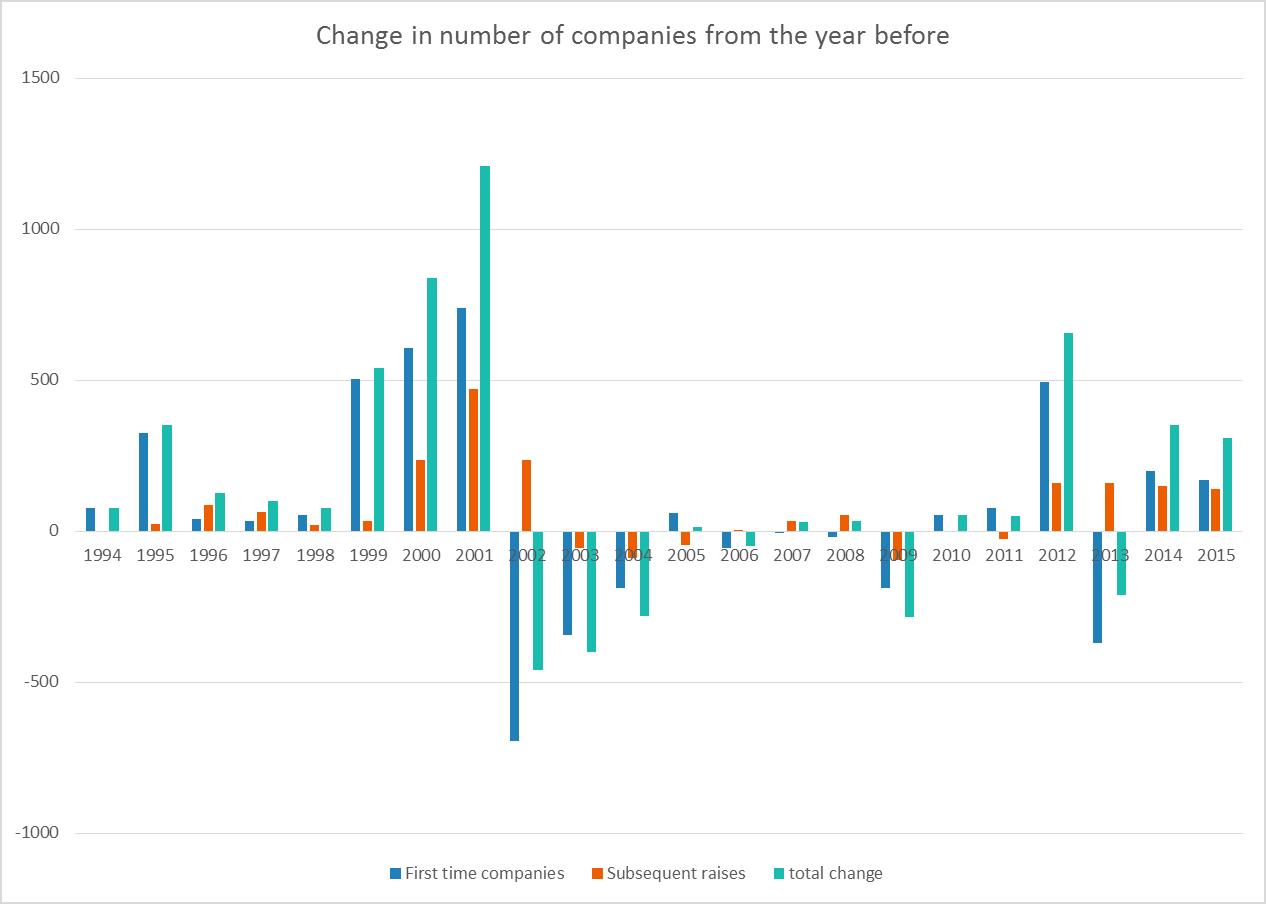
Figure 6

Figure 7
The two charts above present the year-on-year differences in an absolute basis. The total change in any given year is the sum of changes in first time fundings and subsequent fundings.
By presenting the data in this way we are able to identify years in which the two groups moved in different directions. As an example, Figure 7 shows in 2013 there was a drop in the amount of first time fund raising, but there was a rise of similar magnitude in the amount of additional fund raising (more than £100m), resulting in a total change of negative £1.3 million and a seemingly static year for EIS.
Another point worth to note is when a total change is mainly driven by one group of companies. For example, the total amount of EIS investment increased by £90m from 2014 to 2015. Figure 7 shows that the change was completely driven by the increase in subsequent fundings (£90.3m) and the negative new investment actually offset some of the positive growth in subsequent investment.
Conclusions
There has been a clear trend since the inception of the scheme of an increasing proportion of EIS investment going to companies raising additional funds. This seems logical: as the scheme grows there is a bigger universe of companies out there who are seeking follow on EIS investment.
Because the total amount of investment via EIS has also been growing, follow on investment has not necessarily been at the expense of investment into new companies, but this cannot be proven conclusively one way or the other.
We do wonder if a lot of the capital preservation / project based opportunities that were linked to the boom in EIS investment into subsidised renewable energy account for a large proportion of firms raising money for the first time in the period 2008 – 2014.