4
6
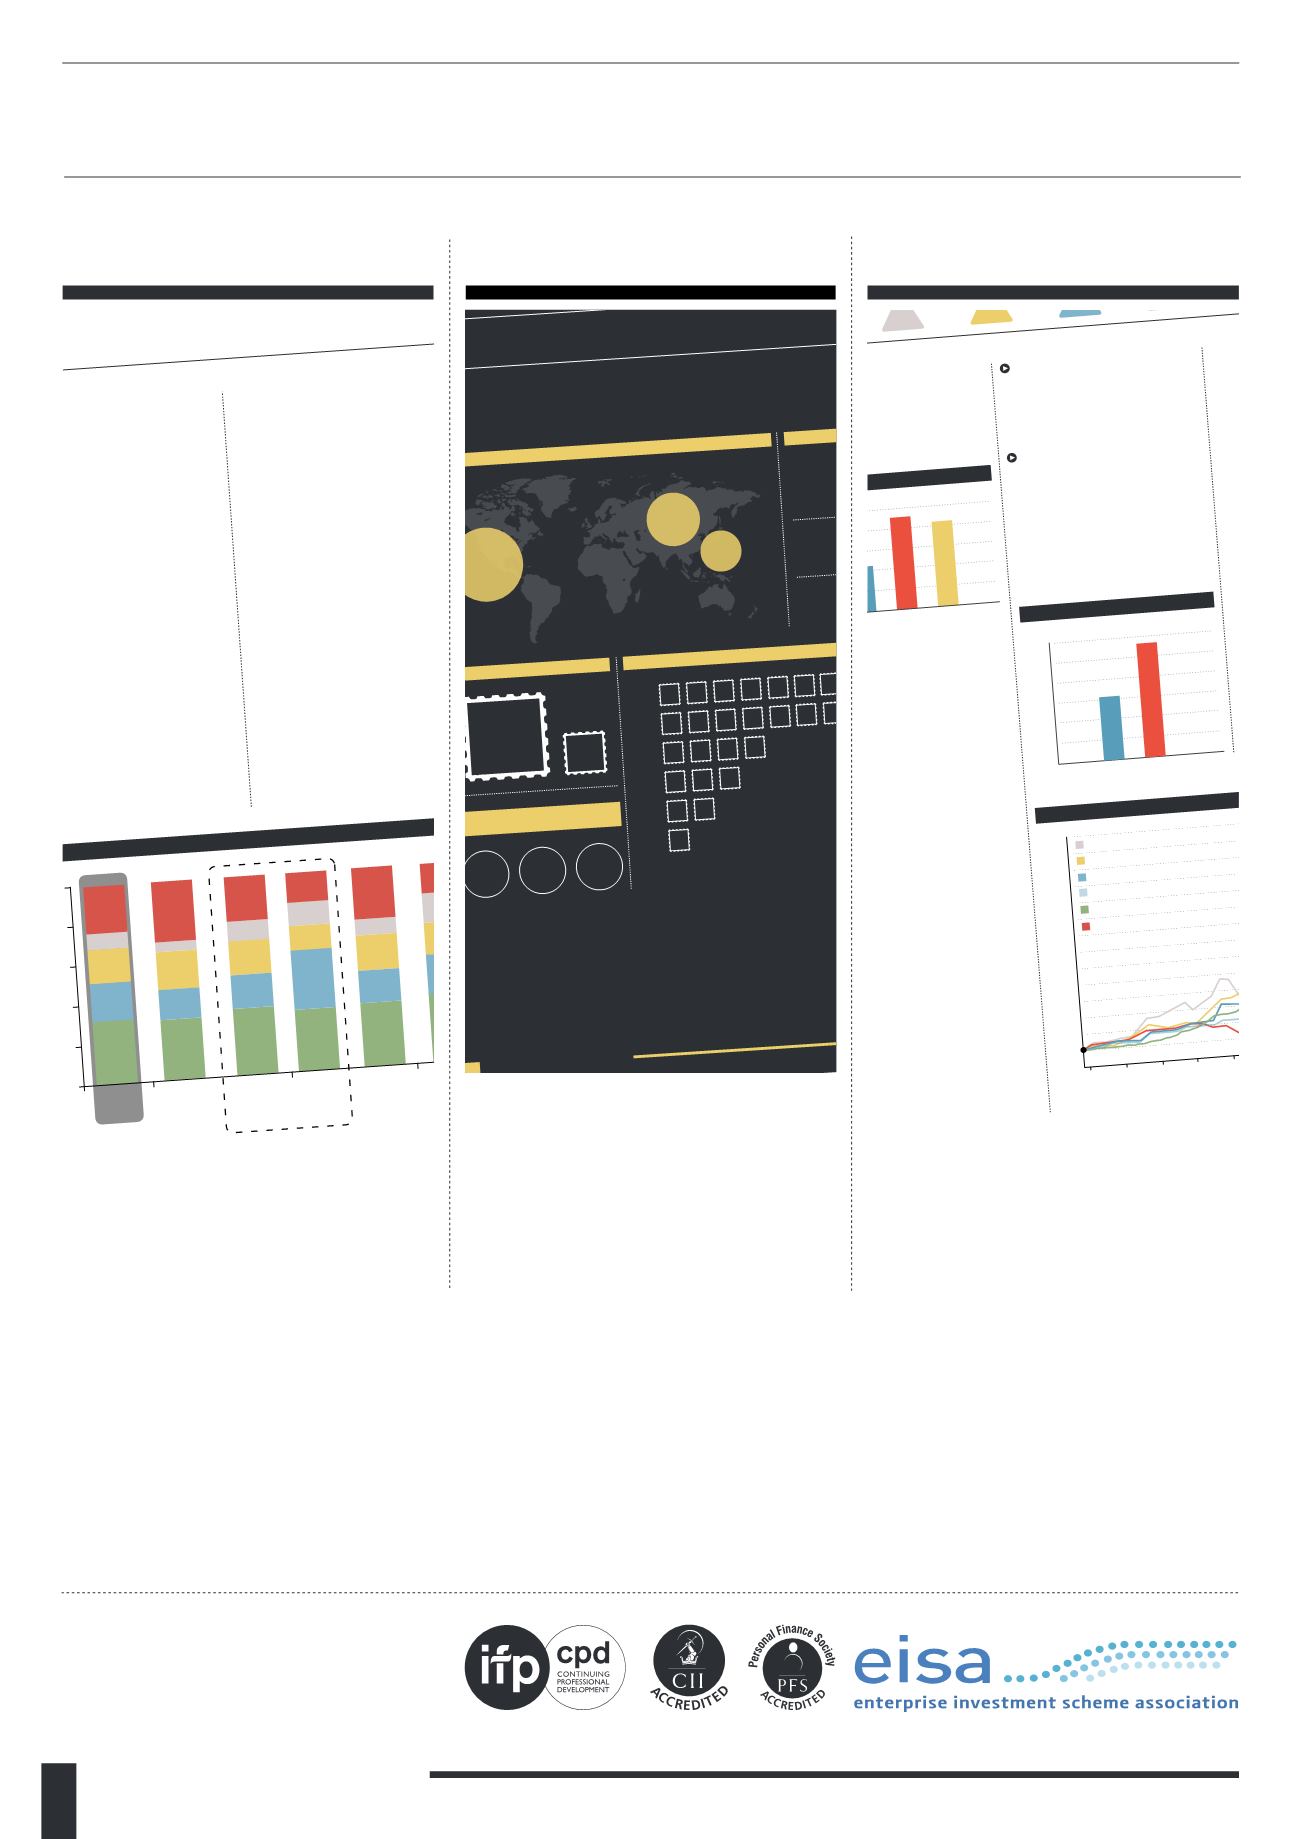
HNWI ALLOCATIONS OF INVESTMENTS OF PASSION
T
he World Wealth Report
4
, previously
produced by Merrill Lynch Wealth
Management and Capgemini, now by RBC
Wealth Management and Capgemini, covers
Investments of Passion, what they refer to
as IoPs, on an annual basis.
According to the 2009 issue of the World
Wealth Report
4*
, the financial crisis and
uncertainty that followed had a marked
impact on the spending patterns of high
net worth individuals (HNWI) and their
spending (and investment) on passion
assets. Although globally spending patterns
varied, on a whole this group of investors
cut back on their spending on luxury goods
and collectible items during 2008. But the
impact of this was relatively short lived, with
HNWIs “cautiously” returning to passion
investments in 2009, although demand
remained weaker than before the crisis
in many categories of assets. Traditional
mainstream investments proved to be
very volatile during the credit crunch and
subsequent economic recession, leaving
many investors facing significant losses.
Those that looked to passion assets for
diversification approached the sector as
“investor-collectors”, looking for tangible
assets as a long-term store of wealth. Even
prior to 2008, passion assets were rising
in value due to increasing demand from
emerging Asian markets – particularly newly
wealthy Chinese and Indian investors. As
the global economy continues to recover,
there are signs that this demand is picking
up once more.
The Wealth Report does not include rare
stamps in its IoP classification, but coins are
included under “Other Collectibles”. Globally
this category of other collectibles accounted
for 24.4% of HNWI’s allocation to IoPs in Q1
2013, but there is a large variation across
geographic regions. The most popular
category across all regions is jewellery, gems
and watches – assets which are likely to be
considered more mainstream.
Therehavebeenattempts tomeasure the
performanceofpassionassets,mostnotably
fromCouttswhocompile the “Coutts Index:
ObjectsofDesire”,andKnightFrankwho
compile the “KnightFrankLuxury Investment
Index”.Both indicesshowstrongperformance
frompassionassetsasawhole,withboth
stampsandcoinsproving tobesomeof the
moststeadyand reliableperformers.
INVESTMENTS OF PASSION
Q1 - 2013
*Represents coins,wine,andantiques,etc.**Represents sports teams, sailing, racehorses,etc.
***Representsautomobiles,boats, jets,etc.
Other collectibles*
Sports Investments**
Art
Luxury Collectibles***
Jewellery, Gems,
& Watches
Middle East
and Africa
Latin
America
Europe
Japan
Asia-Paci c
excl. Europe
North
America
0%
20%
40%
60%
80%
100%
Asia-Paci c
Global
Average
17.1%
17.1%
7.3%
23.6%
35.0%
34.2%
31.7%
30.8%
33.5%
30.3%
31.6%
19.0%
15.2%
16.8%
29.7%
16.2%
19.6%
15.8%
10.6%
8.3%
17.7%
12.2%
11.8%
17.3%
9.4%
4.7%
19.1%
30.6%
8.0%
16.9%
24.4%
23.0%
15.4%
26.2%
19.8%
Investments of passion, or passion
assets, encompass anything that is
tangible and is not a financial asset (it is
not a collective investment scheme, the
asset is not securitised in any way and
there is no income stream for traditional
valuation models to be applied to). They
are essentially high-value luxury items that
people take pleasure from owning.
Examples of passion assets include:
Antiques
Furniture
Chinese ceramics
Vintage watches
Jewellery
Fine wine
Fine art
Rare coins
Rare Stamps
Classic Cars
Source: Capgemini, RBC Wealth Management, and Scorpio Partnership Global HNW Insights Survey 2013
Note: Chart numbers may not add up to 100% due to rounding
8
As collectibles, rare stamps fallunderpassionassetsasdiscussedearlier.Theworld’sfirstadhesive stamps, thepennyblackand twopenny
blue,were iss
don6 hMay1840
2
.Stamps come ina varietyof issues:Definitives;Provisionals;Commemoratives;Miniature sheets;Charity
issuesand Limited issues.Therearealsoanumberofotherkindsof issuewhich canholda special interest for collectors,butusuallyona
smaller scale.
STAMPS IN CONTEXT
$6,911,100
2012
2011
2006
1998
1995
1989
$5,097,100
$2,247,700
$1,746,600
$1,186,400
$550,500
UK
7%
CHINA
17%
US
9%
1975
1000+
60
MILLION
GLOBALLY
40
MILLION
INASIA
20
MILLION
IN CHINA
STAMPS IN NUMBERS
NUMBER OF COLLECTORS
VALUE OF CHINA’S STAMP INDEX
DEALERS IN THE US
INVESTORS WITH WEALTH IN
STAMPS AND ALTERNATIVES**
2013
490
Source:*includesasdamembersasdamembers** includesart,wine, jewellery,antiquesandother collectables.
BILLION
GLOBAL VALUE
$3
200
9000
NEW STAMPS
ISSUED EVERY YEAR
COUNTRIES
ISSUING STAMPS
2013
1989 -2012
1975 -2013
CONTENTS
The compound annual growth of the GB30
Rarities Index over the past 5 years was
4.51%, compared to 9.06% over 10 years
and 8.37% over 20 years. The 1873 2½d.
rosy mauve (Unused) achieved annualised
compound growth of 10.76% over the last 5
years, double the growth of the index.
GB
250
INDEX
The Stanley Gibbons GB250 tracks the
performance of the top 250 traded
investment grade British stamps over
the last 12 years. It is accessible via
the Bloomberg Professional® service
(STGIGB25) and is frequently quoted
in the financial press as it provides a
broad view of the investment market for
British stamps. This is the largest stamp
index in existence and used by many in
the industry to track and evidence the
performance and returns on rare stamp
investing. This index includes watermark
varieties, specimens, errors and
Government Officials.
Again there are limitations to this index:
Higher priced stamps have a higher
weighting in the index (which takes an
average based on price) and therefore more
impact on the overall performance of the
index (for the positive or negative).
A number of stamps included in this
index are far too expensive for the vast
majority of investors to purchase (if looking
to create a diversified stamp portfolio
containing a number of stamps).
It is not realistic for an investor to
purchase/own all 250 stamps – unlike the
FTSE for example, when an investor can
invest in an ETF which covers the whole
index. Therefore investors cannot diversify
across the index as a whole.
STANLEY GIBB
MARKET STU
The Stanley Gibbon
tracked the prices a
rare investment gra
data is not on the B
Service® quoted b
selected by expert
section of the Chin
market as a whole
This data tracks t
stamps from 198
Stamps range in
at 1989 prices - £
The total value o
in this study has
in 1989 to £4,52
over £4.1m – co
10.7% over 25 y
The China 200 i
over the previo
performance o
been far more
GB250. Retur
range from a l
of 2,809.09%
COLLECTIBLE INVESTMENT INDICES
750
700
650
600
550
500
450
400
350
300
250
200
150
100
50
2004
2005
2006
2007
2008
2009
2
Source:WorldGoldCouncil, LondonSilver Fixing, FTSE,StanleyGibbons,
There is a wide variance in the
performance of individual stamps – how
does an investor know which to purchase?
This is where knowledge, research and
analysis are important, but analysing past
performance has many limitations.
The index (as with the GB30 and
China 200) is limited to Stanley Gibbons’
catalogue prices.
The GB250 index has seen a total return of
195.02% over the last 10 years – compound
annual growth of 11.4%. Compound annual
growth over the last 5 years has been
only 6.04% - stamps have not performed
as strongly since the financial crisis and
throughout the recession
Silver
Gold
GB200 Coin Index
GB250 Stamp Index
Liv-Ex
FTSE 100
GB30 ANNUAL GROWTH*
0%
Last
5yrs
Last
10yrs
Last
20yrs
2%
4%
6%
8%
10%
GB250 ANNUAL GROWTH*
0%
Last
5yrs
Last
10yrs
2%
4%
6%
8%
10%
12%
10 YEAR
ANNUAL
GROWTH (%):
*Compoundannualgrowth
SILVER
12.38
11.43
TBC
13.42
14.32
GOLD
COINS
STAMPS
WINE
RATIONALE
STAMPS &COINS
INVESTMENT CASE
RATIONALE
INVESTMENTS OF PASSION
8
10
11
12
7
RETURNS
DIVERSIFICATION
CONSIDERATIONS
17
14
Intelligent Partnership is committed to
the very highest professional standards
as embodied by our accreditation and
membership to these industry associations.
Please note: Unless otherwise stated, all charts and graphs have been provided by Intelligent Partnership
13
17
STAMPS IN CONTEXT
INVESTING
COLLECTING
COINS IN CONTEXT


